Advanced workflows with the Cityweft Rhino & Grasshopper plugin
The Cityweft Rhino plugin is more than a one-click city model importer.
Combined with Grasshopper, it becomes a flexible system for defining site context, controlling geometry output, and building custom analytical workflows directly inside Rhino.
In this post, we’ll walk through a complete example file and show how the plugin components can be combined to create custom, parametric city-context workflows — from model setup and location selection to metadata-driven visualization.
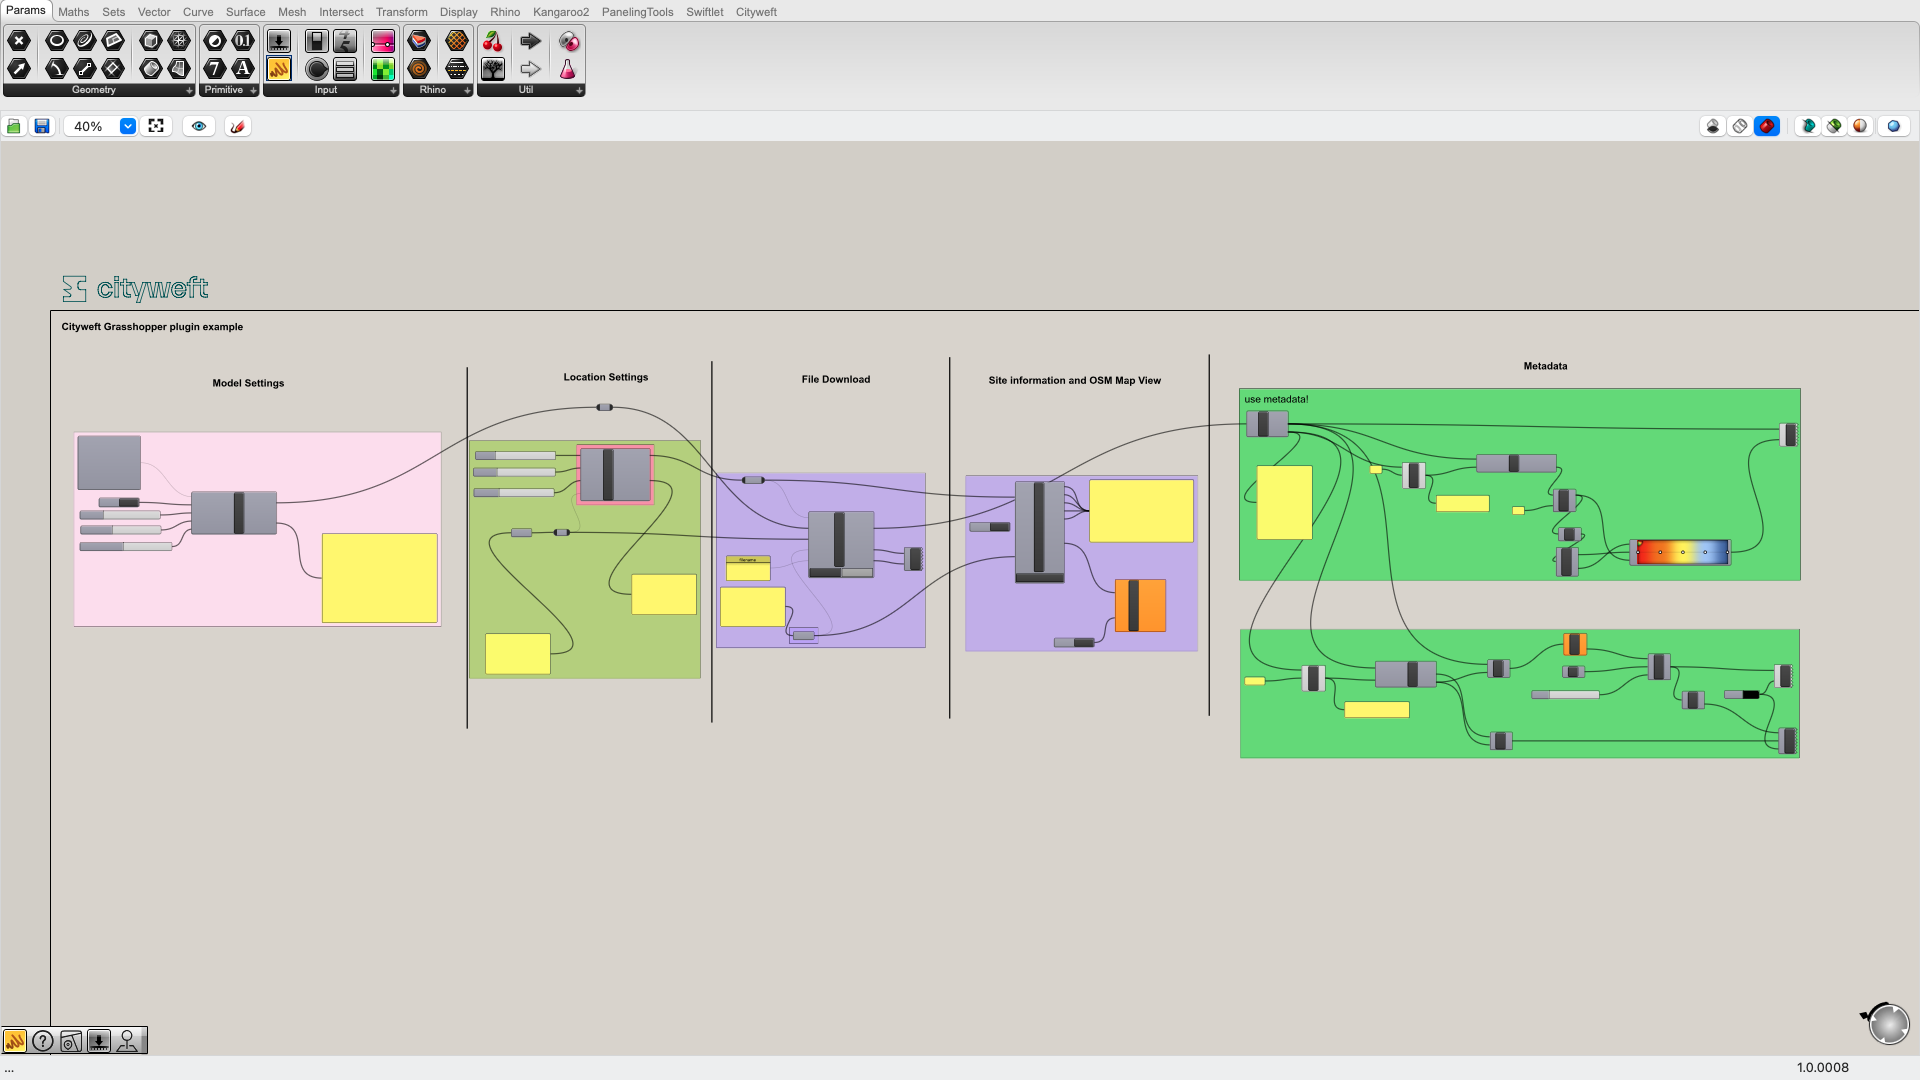
Each section below corresponds to a core part of the Grasshopper definition.
1. Model settings
Controlling what gets imported — and how
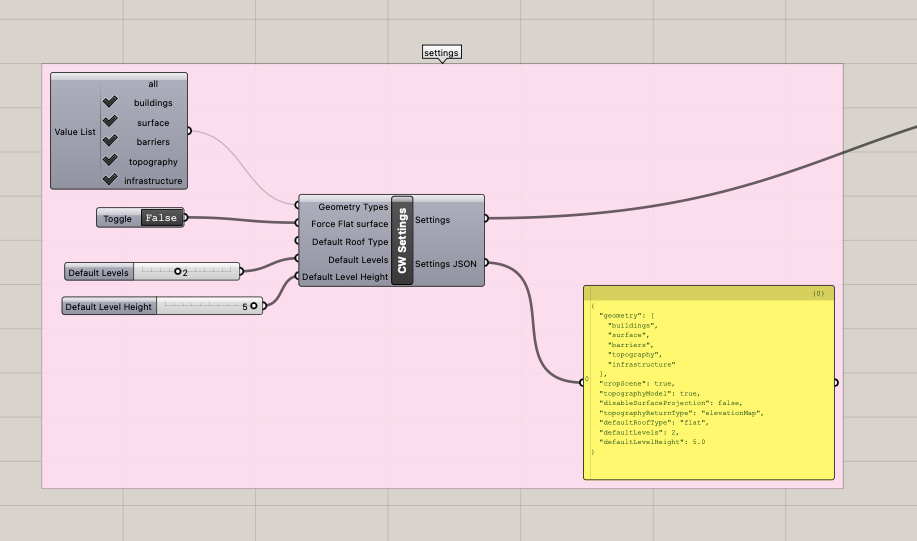
The Model Settings component defines how Cityweft generates geometry for your project. This is where you decide what kind of city model you want, before any data is downloaded.
Using this component, you can configure:
Geometry types
Choose exactly which geometry layers to include:
Buildings
Surface
Barriers
Topography
Infrastructure
Force flat surface
This setting controls how surfaces are created:
When enabled, surfaces are projected onto the topography
When disabled, surfaces are generated as a separate flat layer at Z = 0
This is particularly useful when switching between terrain-aware studies and clean, diagrammatic workflows.
Default roof type
If roof information is missing in the source data, this parameter defines which roof type should be applied by default — ensuring consistent geometry even in incomplete datasets.
Default levels & default level height
When building height or level data is unavailable, Cityweft fills in the gaps using:
Default number of levels
Default level height
This guarantees usable volumetric models across regions with varying data quality.
Output:The component outputs a consolidated Settings object, which is passed directly into downstream components.
2. Location settings
Defining your site — visually or parametrically
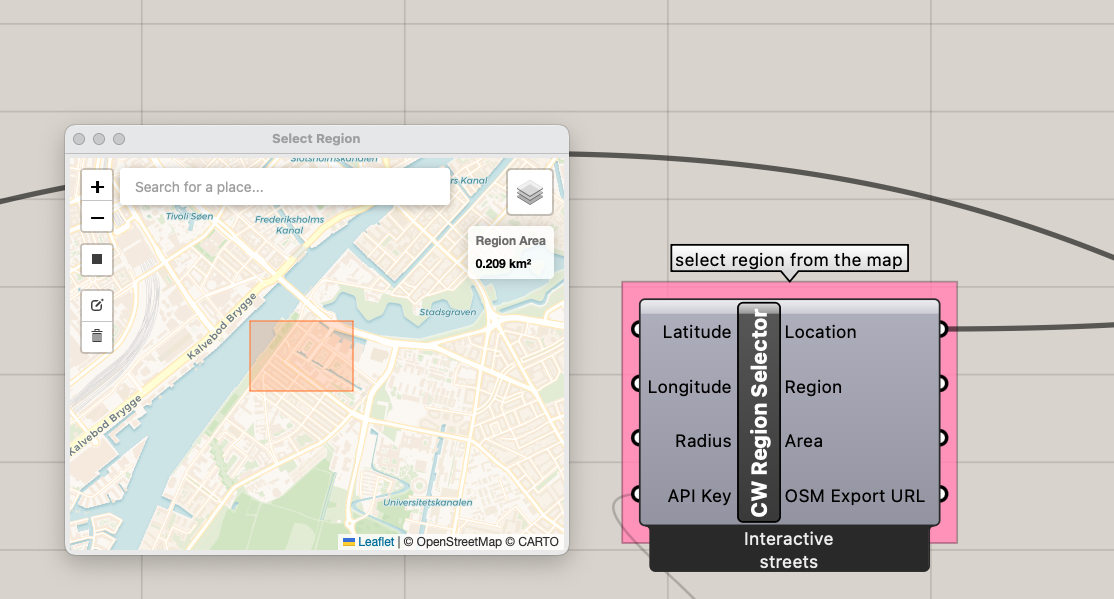
The CW Region Selector component defines where your city data comes from.
You have two ways to work:
Map-based selection
By double-clicking the component, you open an interactive map view where you can draw the import boundary directly. This is ideal for:
Intuitive site selection
Irregular or custom boundaries
Quick exploratory work
Parametric selection
Alternatively, you can define the region using:
Latitude
Longitude
Radius
This approach is powerful when:
Driving location from other data
Iterating over multiple sites
Creating scripted or automated workflows
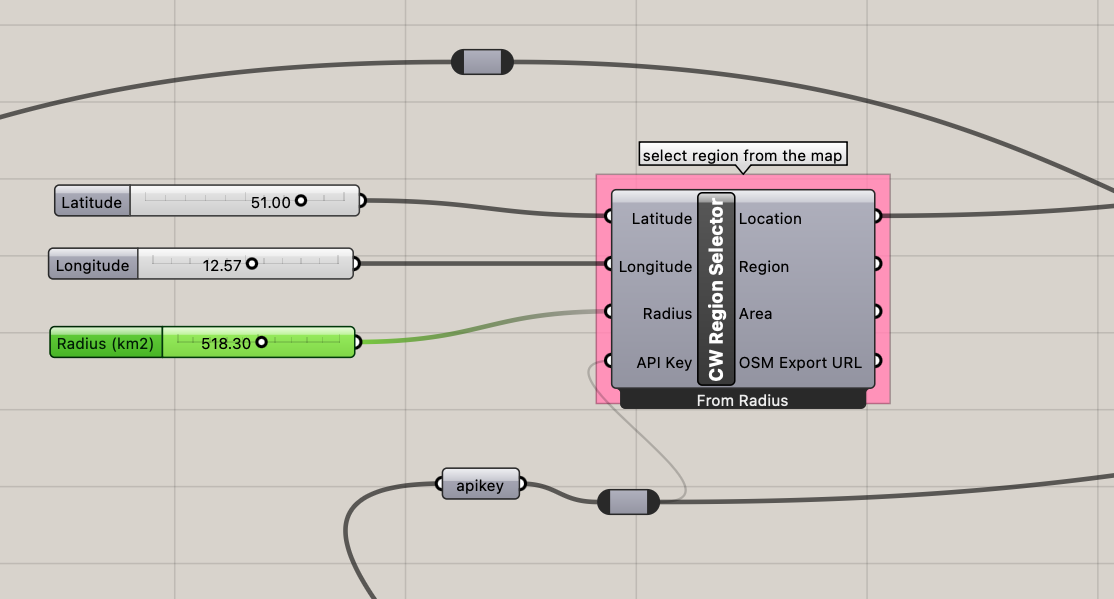
Outputs:
Location – the main region object, used as input in other components
Center – center point coordinates (latitude, longitude)
Area – calculated area of the region (km²)
Bounds – bounding box as text (south, west, north, east)
These outputs make the location reusable across analysis, labeling, and documentation workflows.
3. 3DM Downloader
From parameters to geometry — saved directly to disk
The 3DM Downloader component is where everything comes together.
Inputs:
Location (from the Region Selector)
Settings (from Model Settings)
API Key
Save Folder
File Name
Once configured, clicking the Download button triggers the process:
Cityweft generates the city model
The .3dm file is downloaded
The file is saved directly to the specified folder
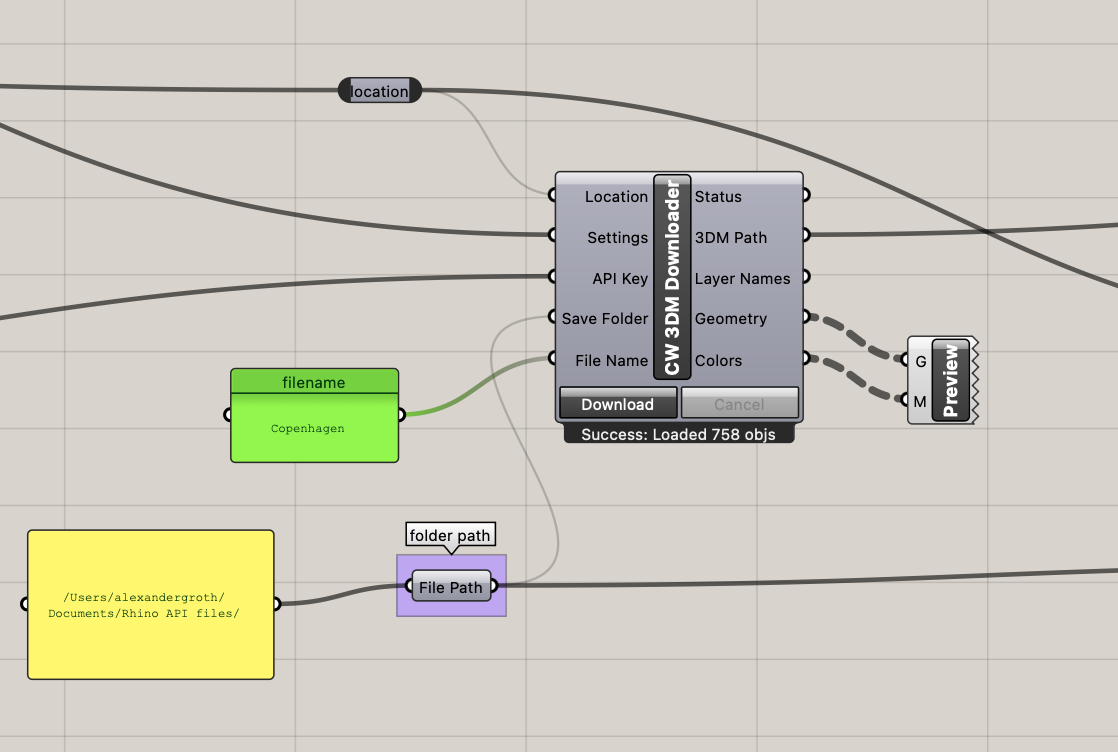
Outputs:
Status – current state of the download process
3DM Path – file path where the model is saved
Layer Names – all generated Rhino layers
Geometry – the imported geometry
Colors – color information per object
This makes it easy to both:
Reference the saved file externally
Continue working with the geometry directly in Grasshopper
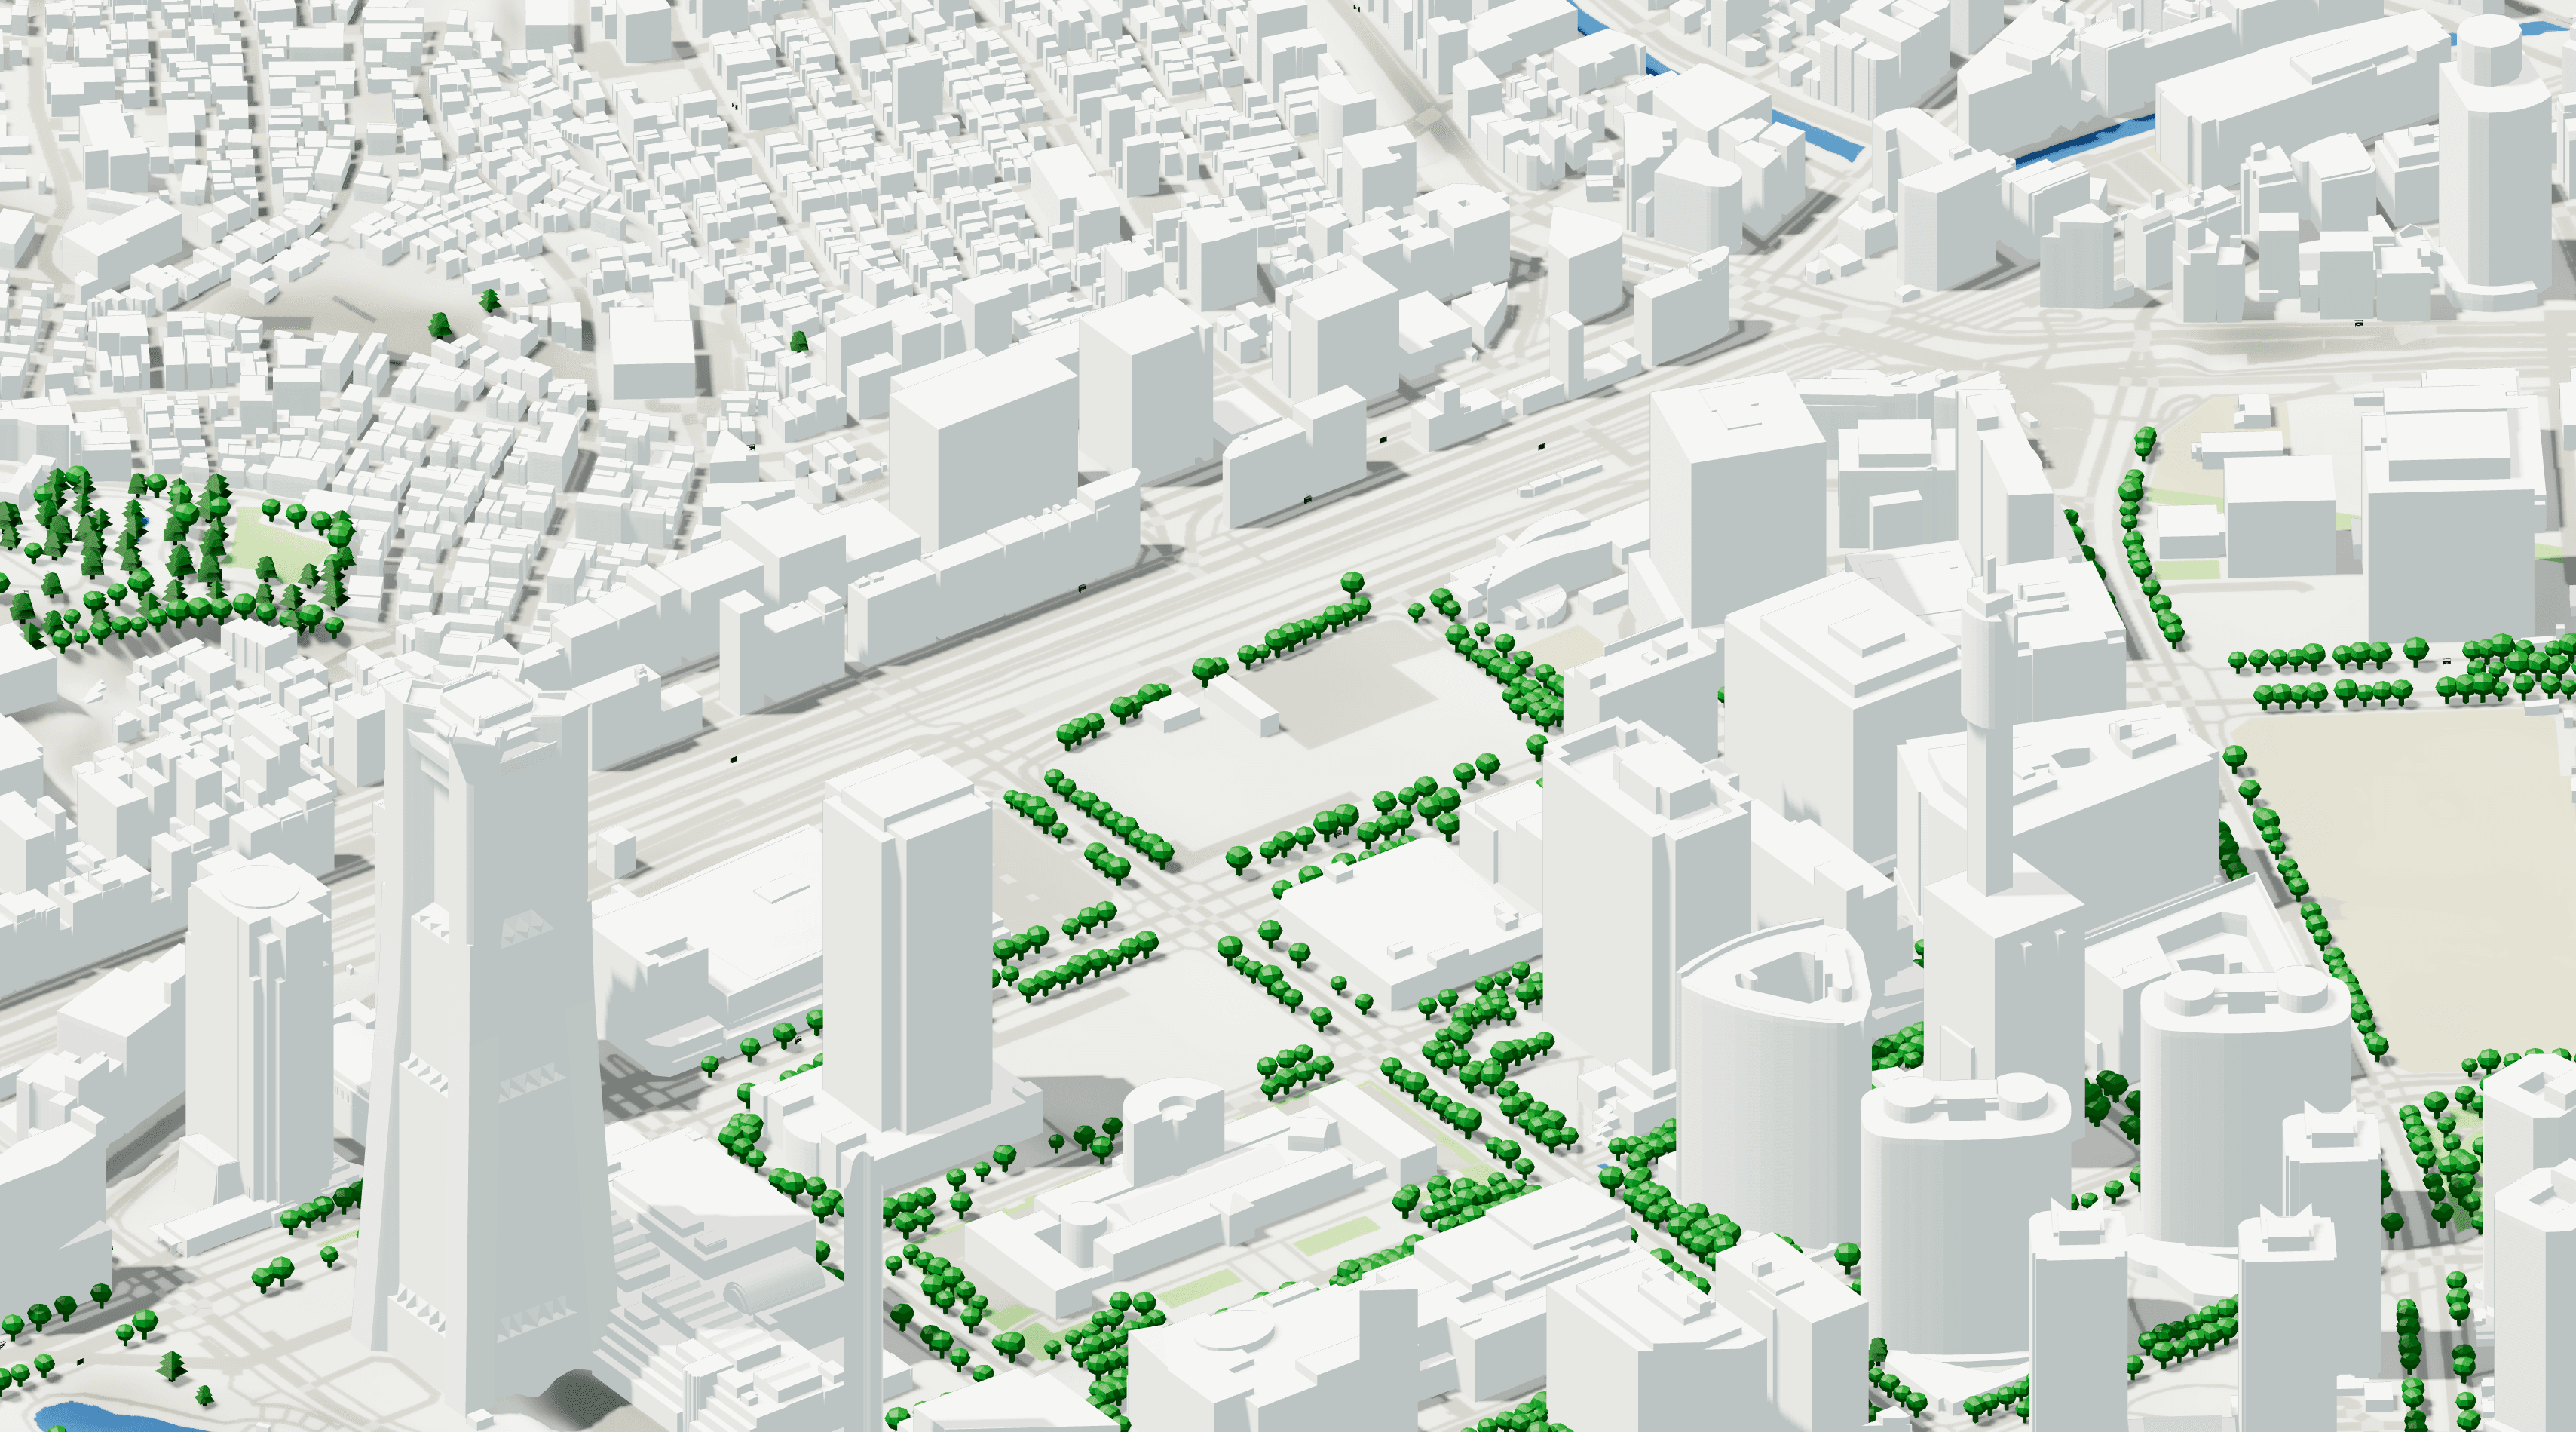
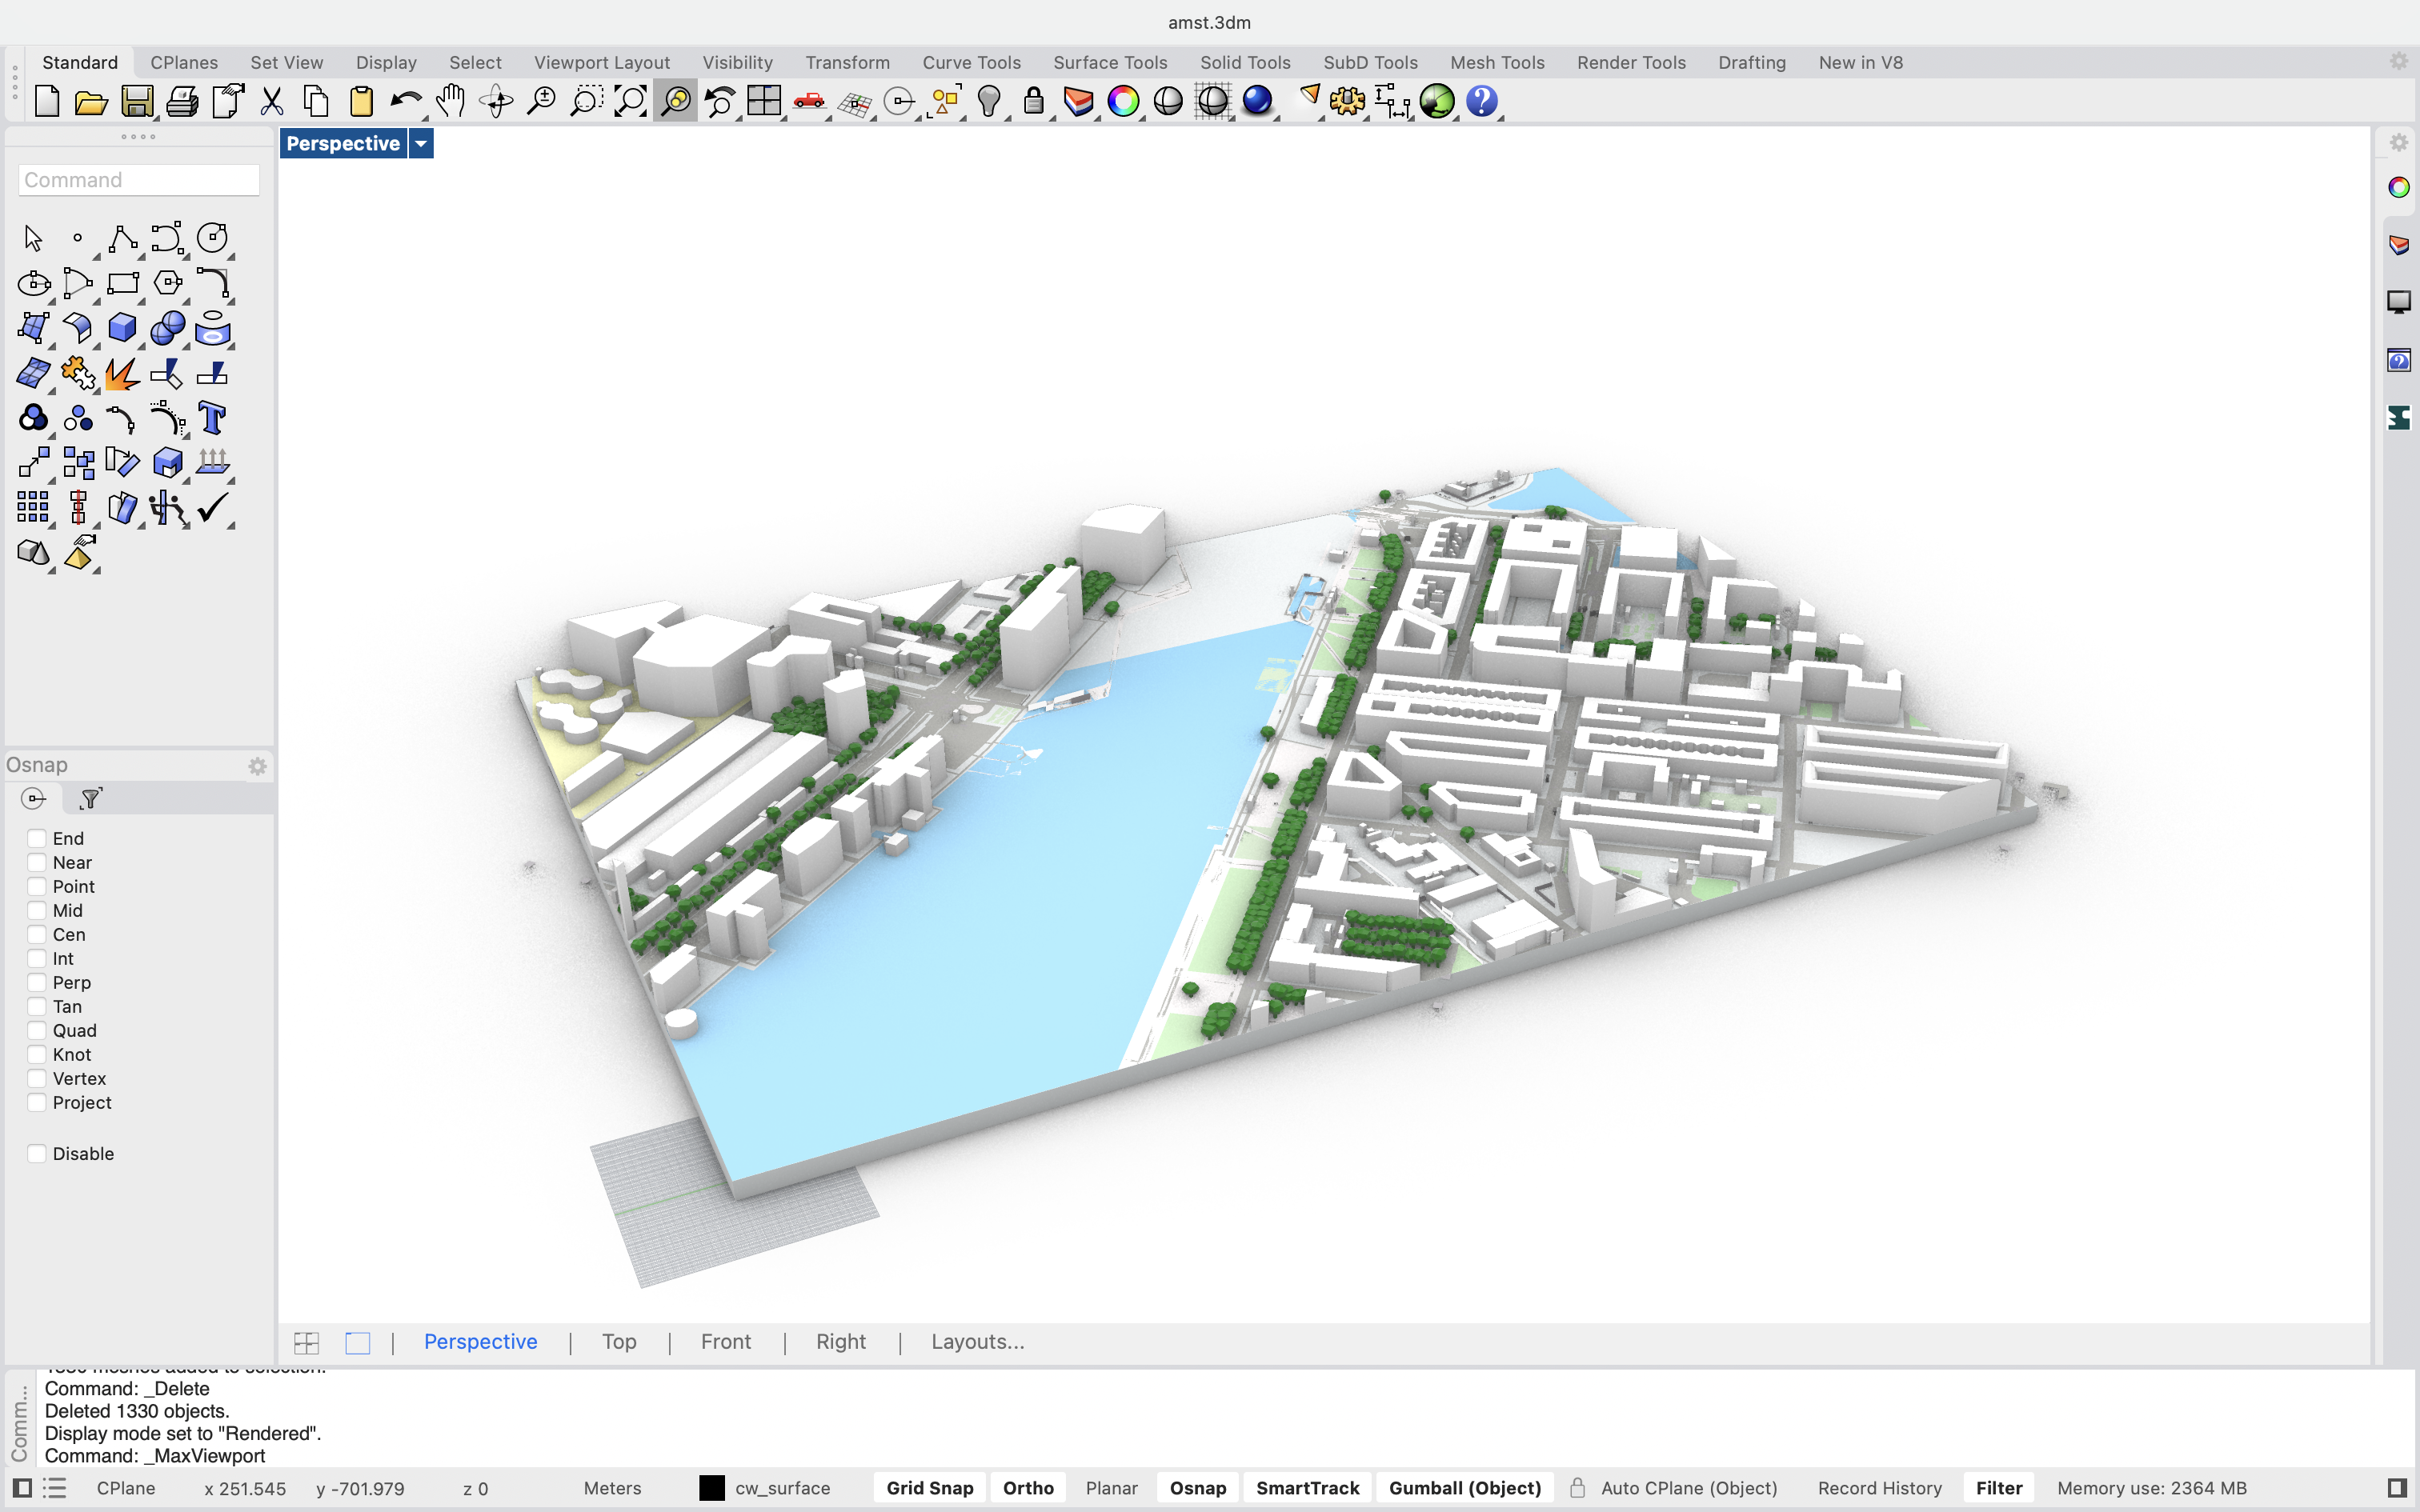
With a simple custom preview component, you can already view your model in the viewport:
4. Site information and OSM map
Contextual information beyond geometry
Cityweft isn’t limited to 3D geometry. Using the CW Region Address component, you can extract site metadata directly from the selected location.
CW Region Address outputs:
Address
Road
City
Country
Postal code
This is especially useful for:
Automated project naming
Title blocks
Report generation
Competition workflows
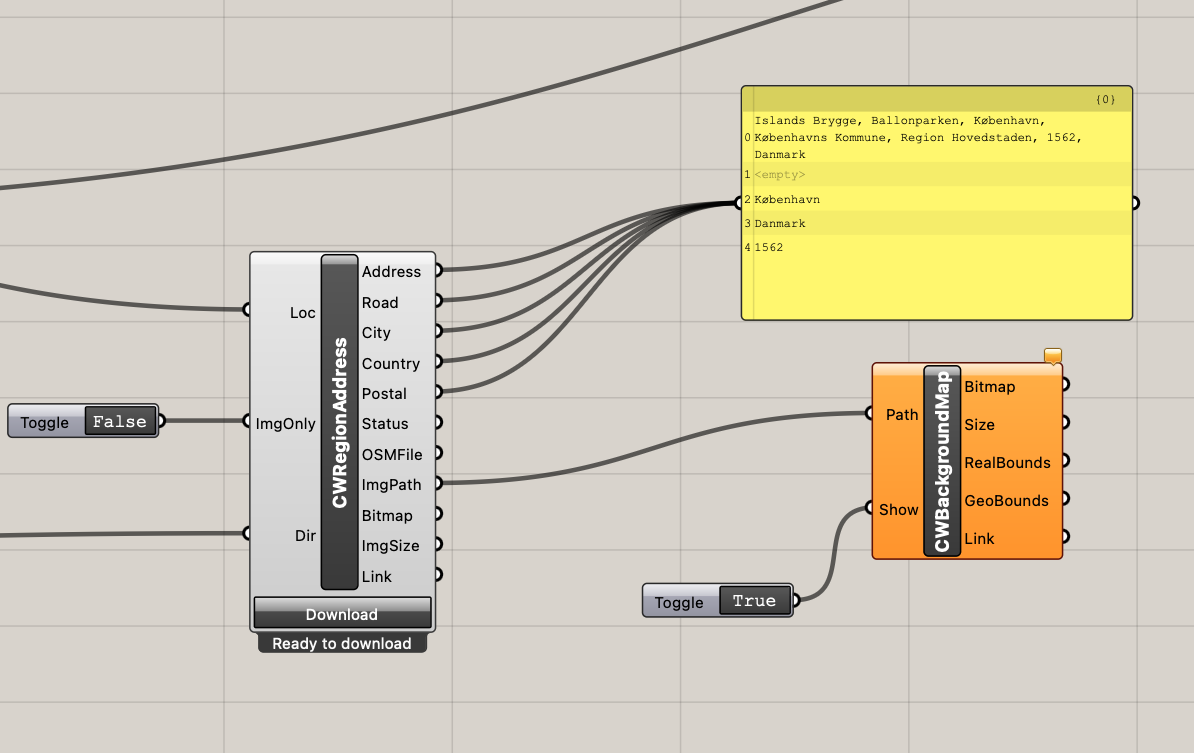
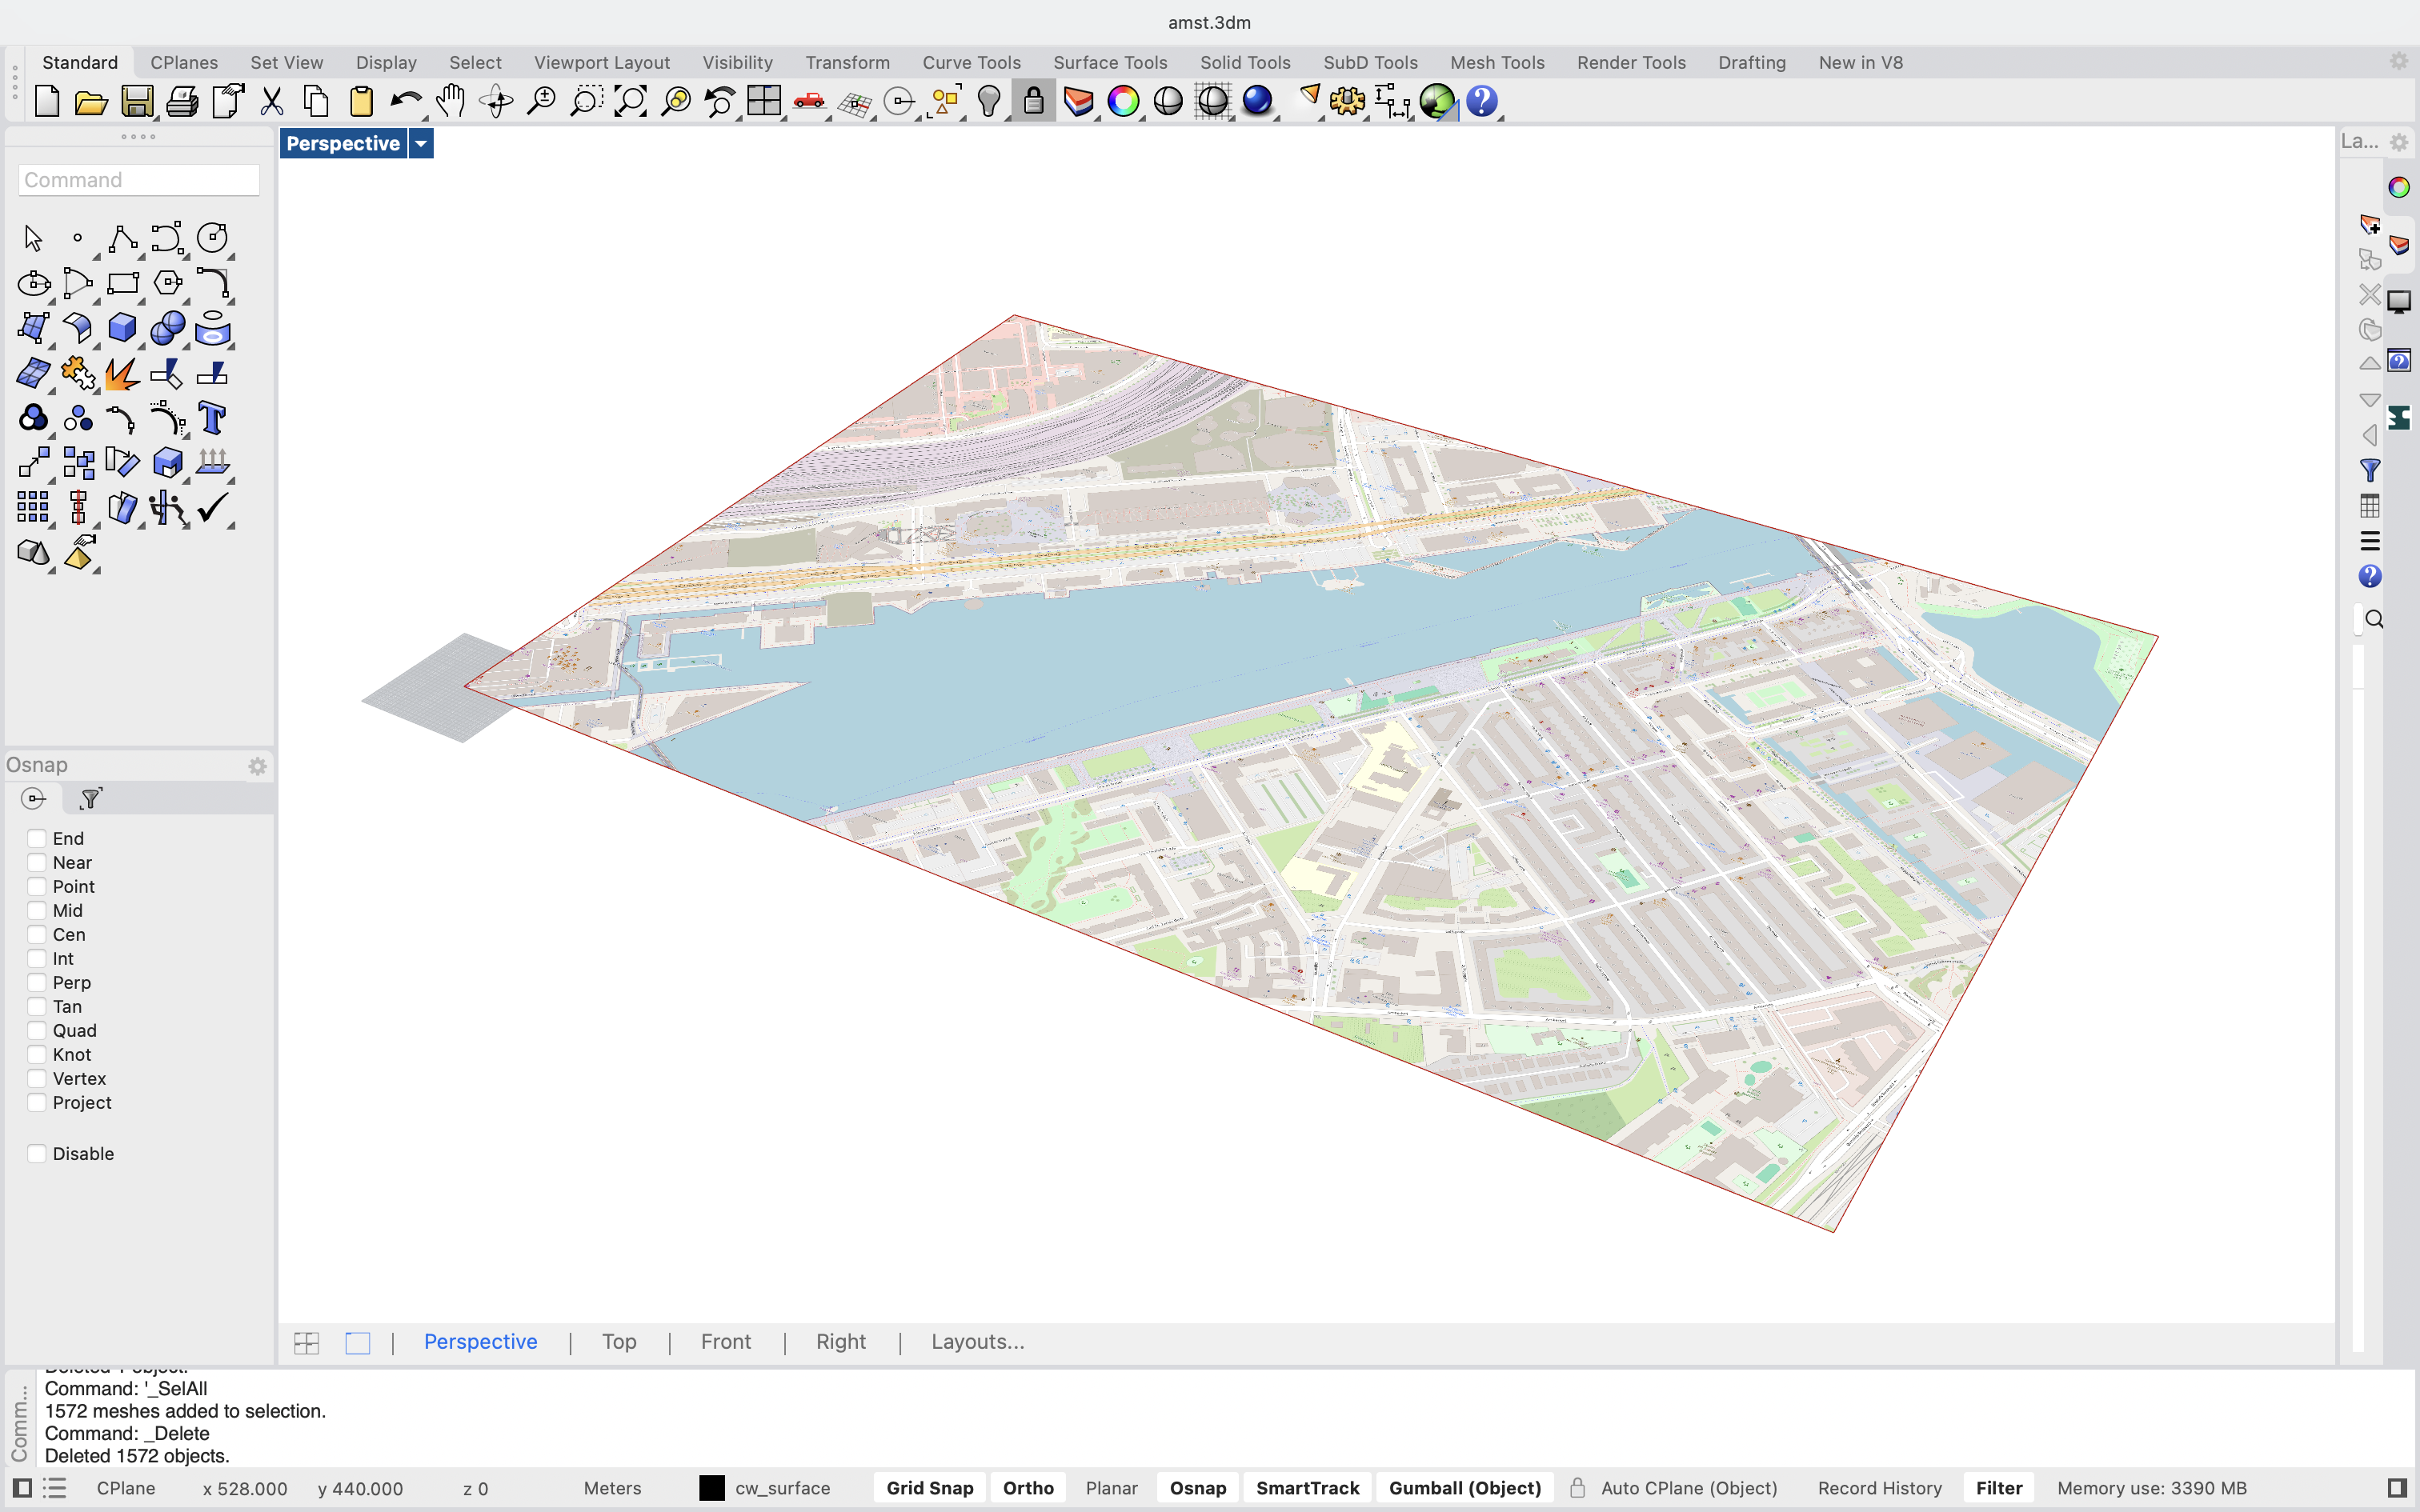
2D map download
The same component allows you to download a 2D map image of the selected area. The map is saved to the folder specified in the Dir input.
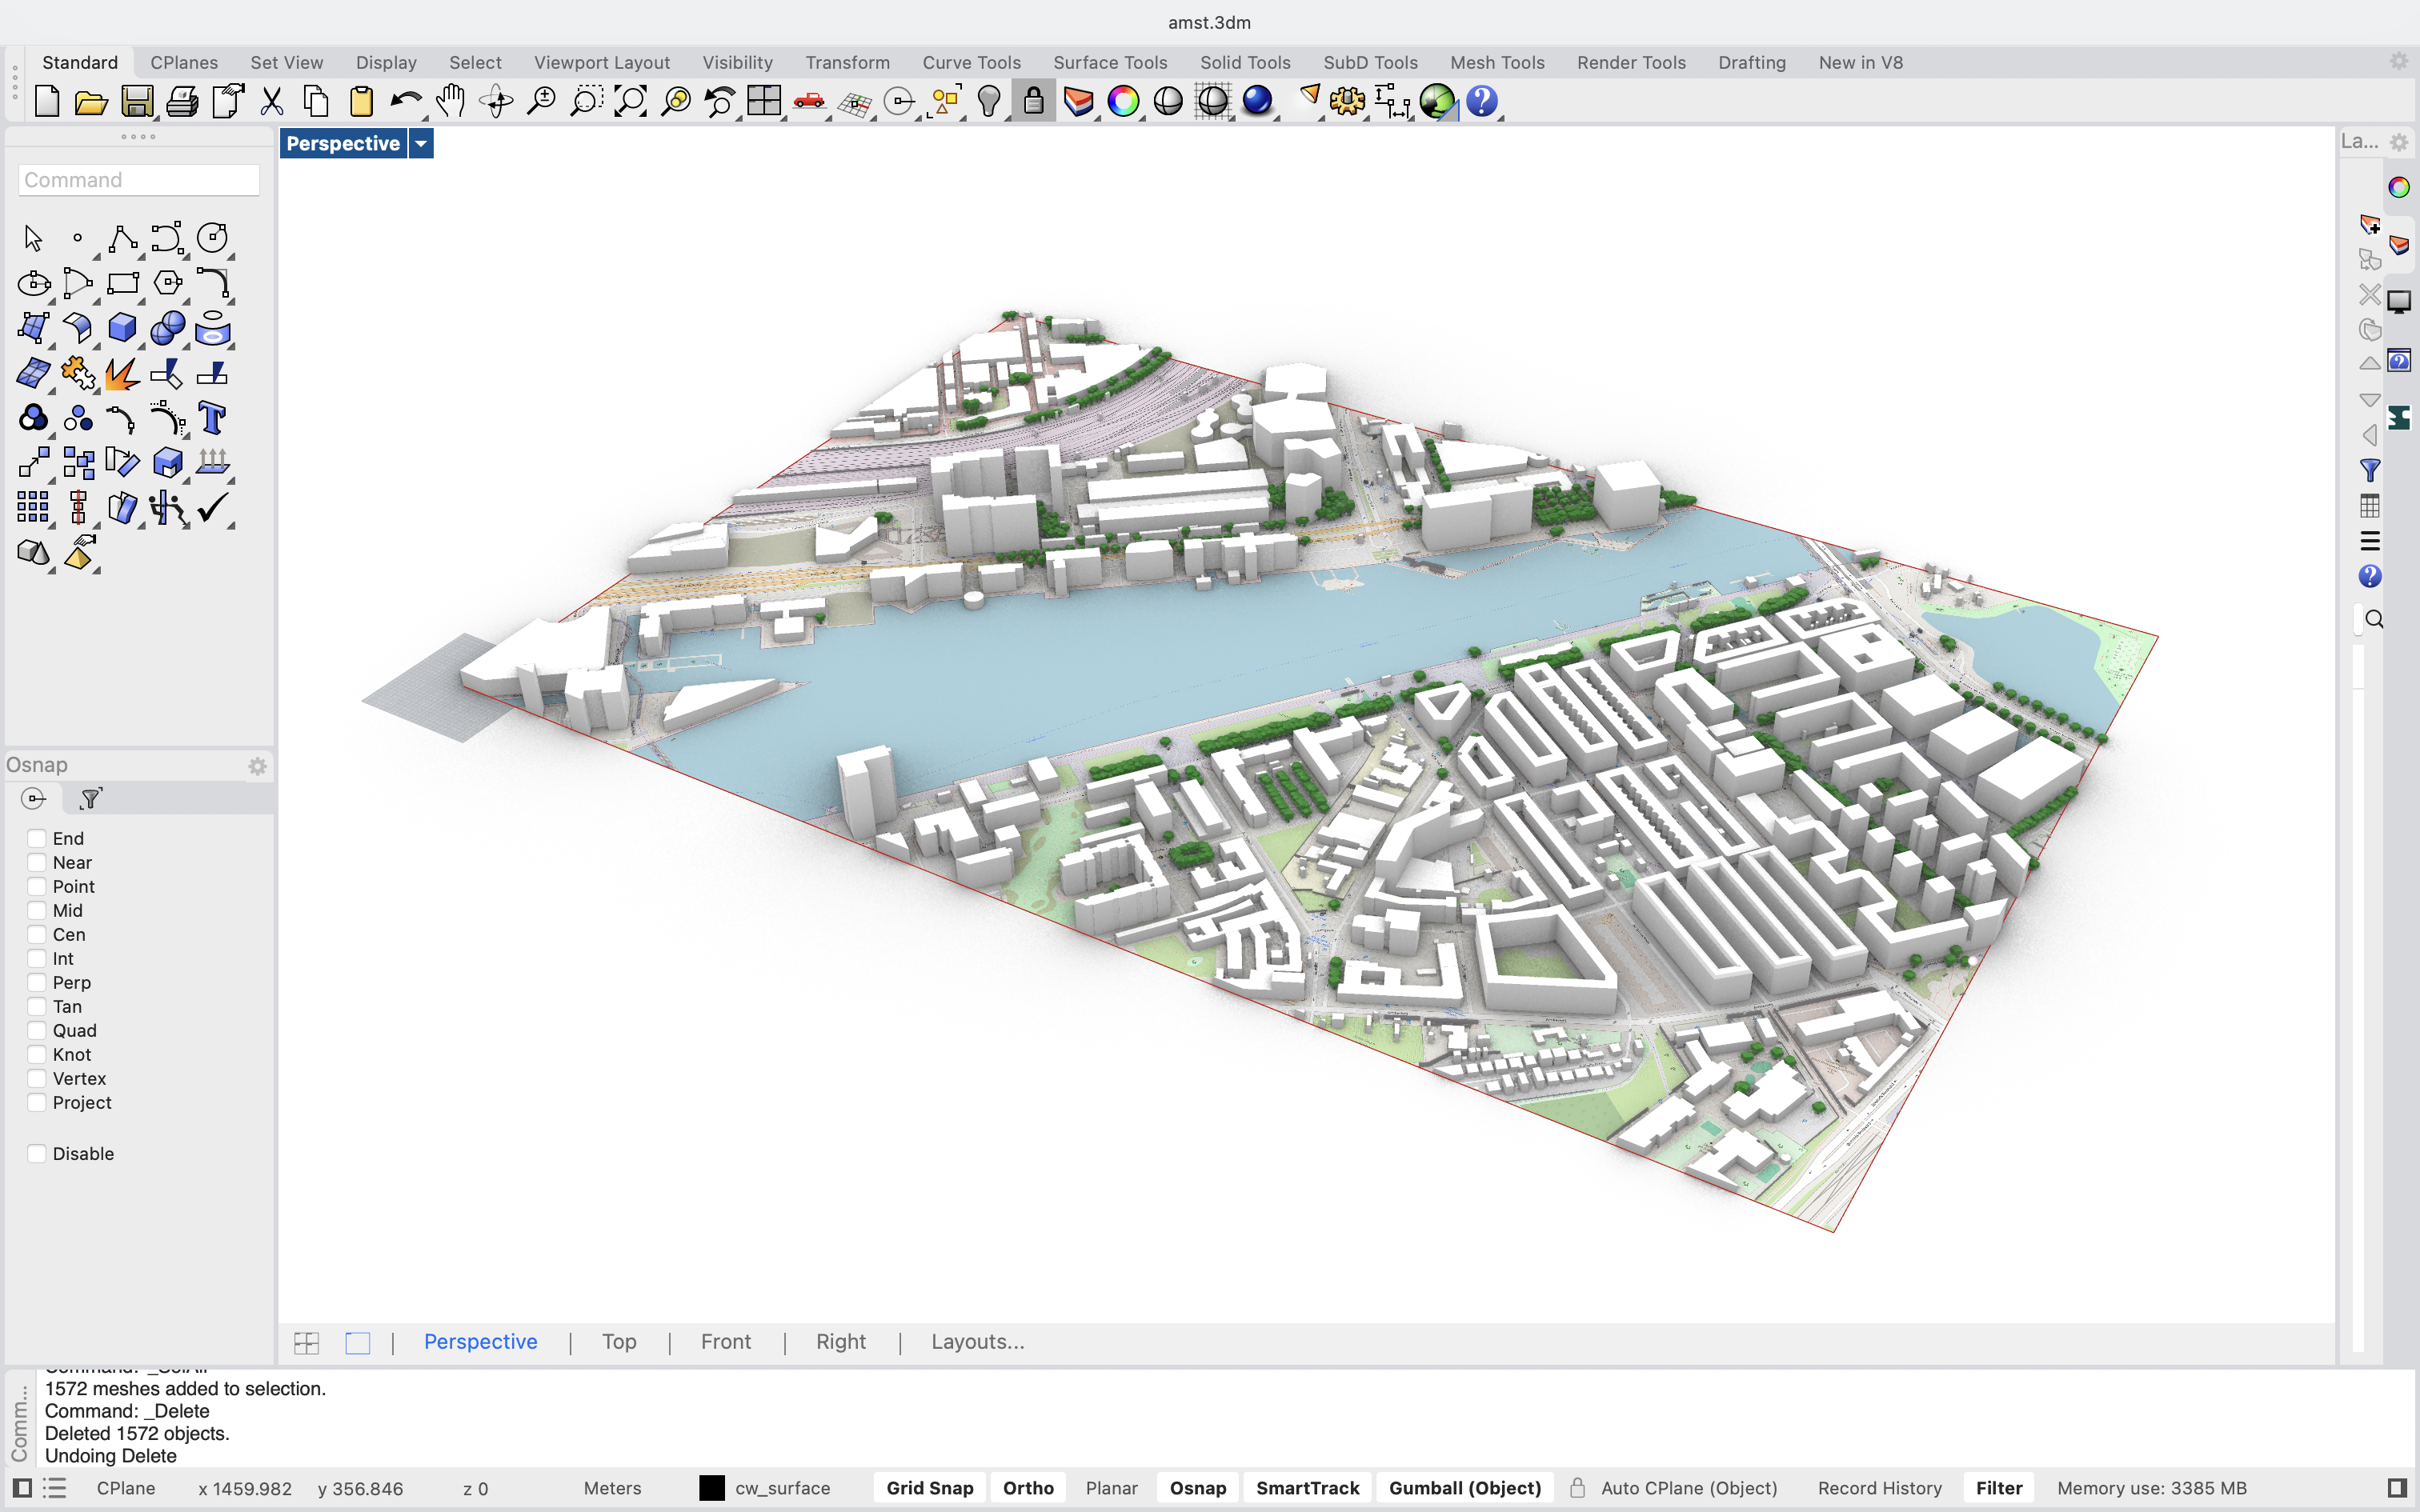
By connecting this output to CWBackgroundMap, the 2D map is displayed directly in the Rhino viewport — giving you a live reference layer beneath your 3D model.
5. Metadata workflows
Using Cityweft geometry as analytical input
While metadata extraction is not a standalone component in the plugin, Cityweft geometry is structured to work seamlessly with custom Grasshopper logic.
In this example file, we show two metadata-driven workflows:
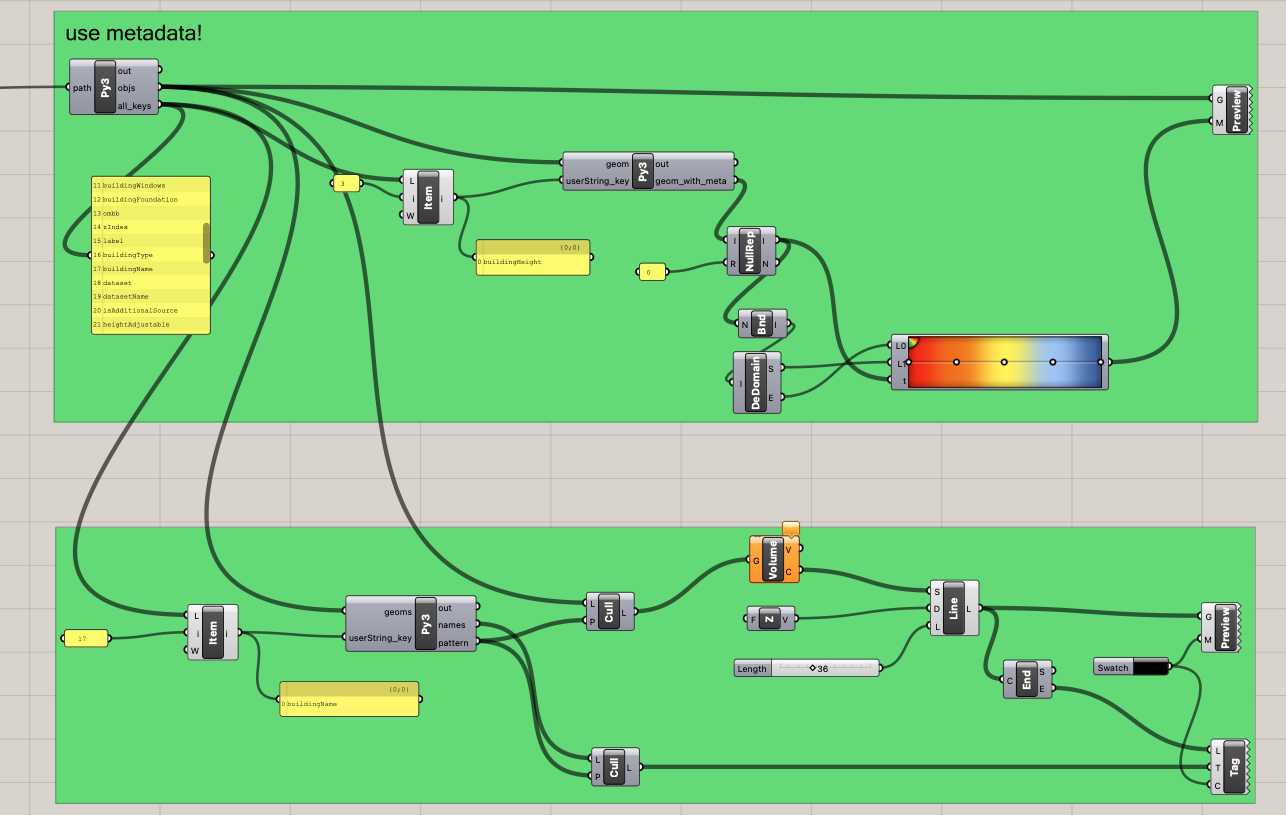
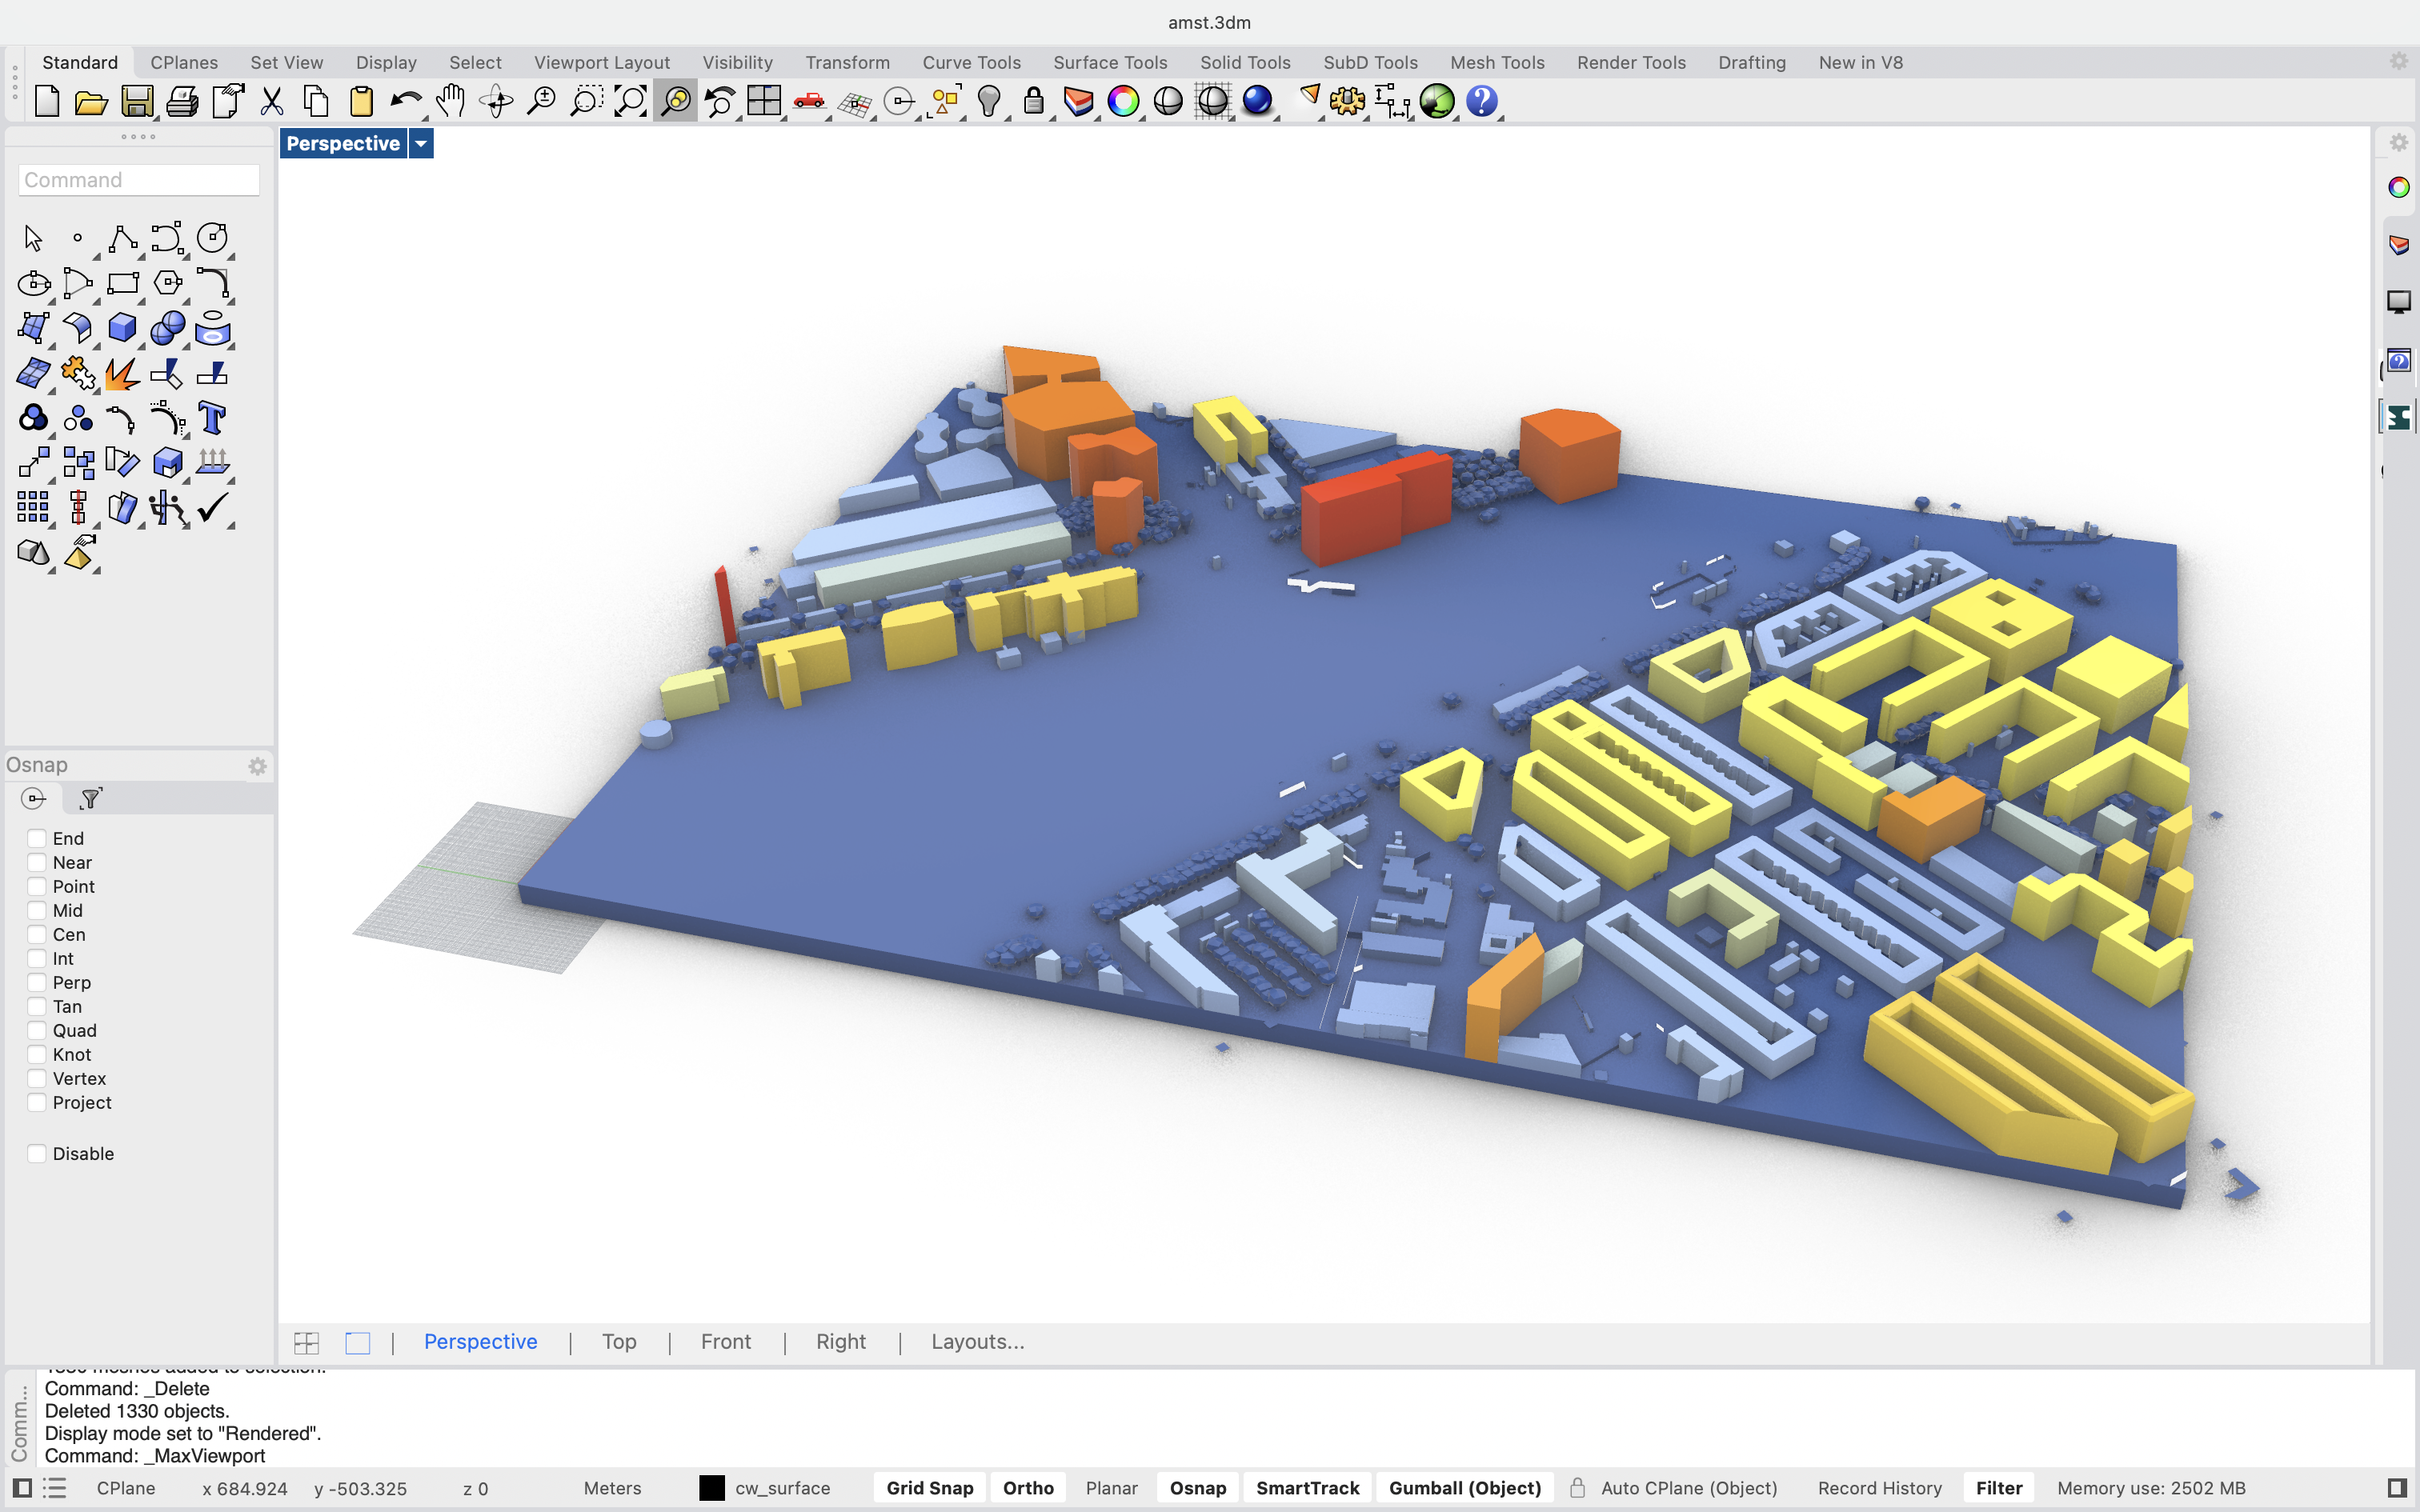
Color buildings by height
By reading building height from the geometry, we:
Normalize values
Apply a color gradient
Automatically visualize height distribution across the site
This is useful for:
Urban scale analysis
Density studies
Early zoning exploration
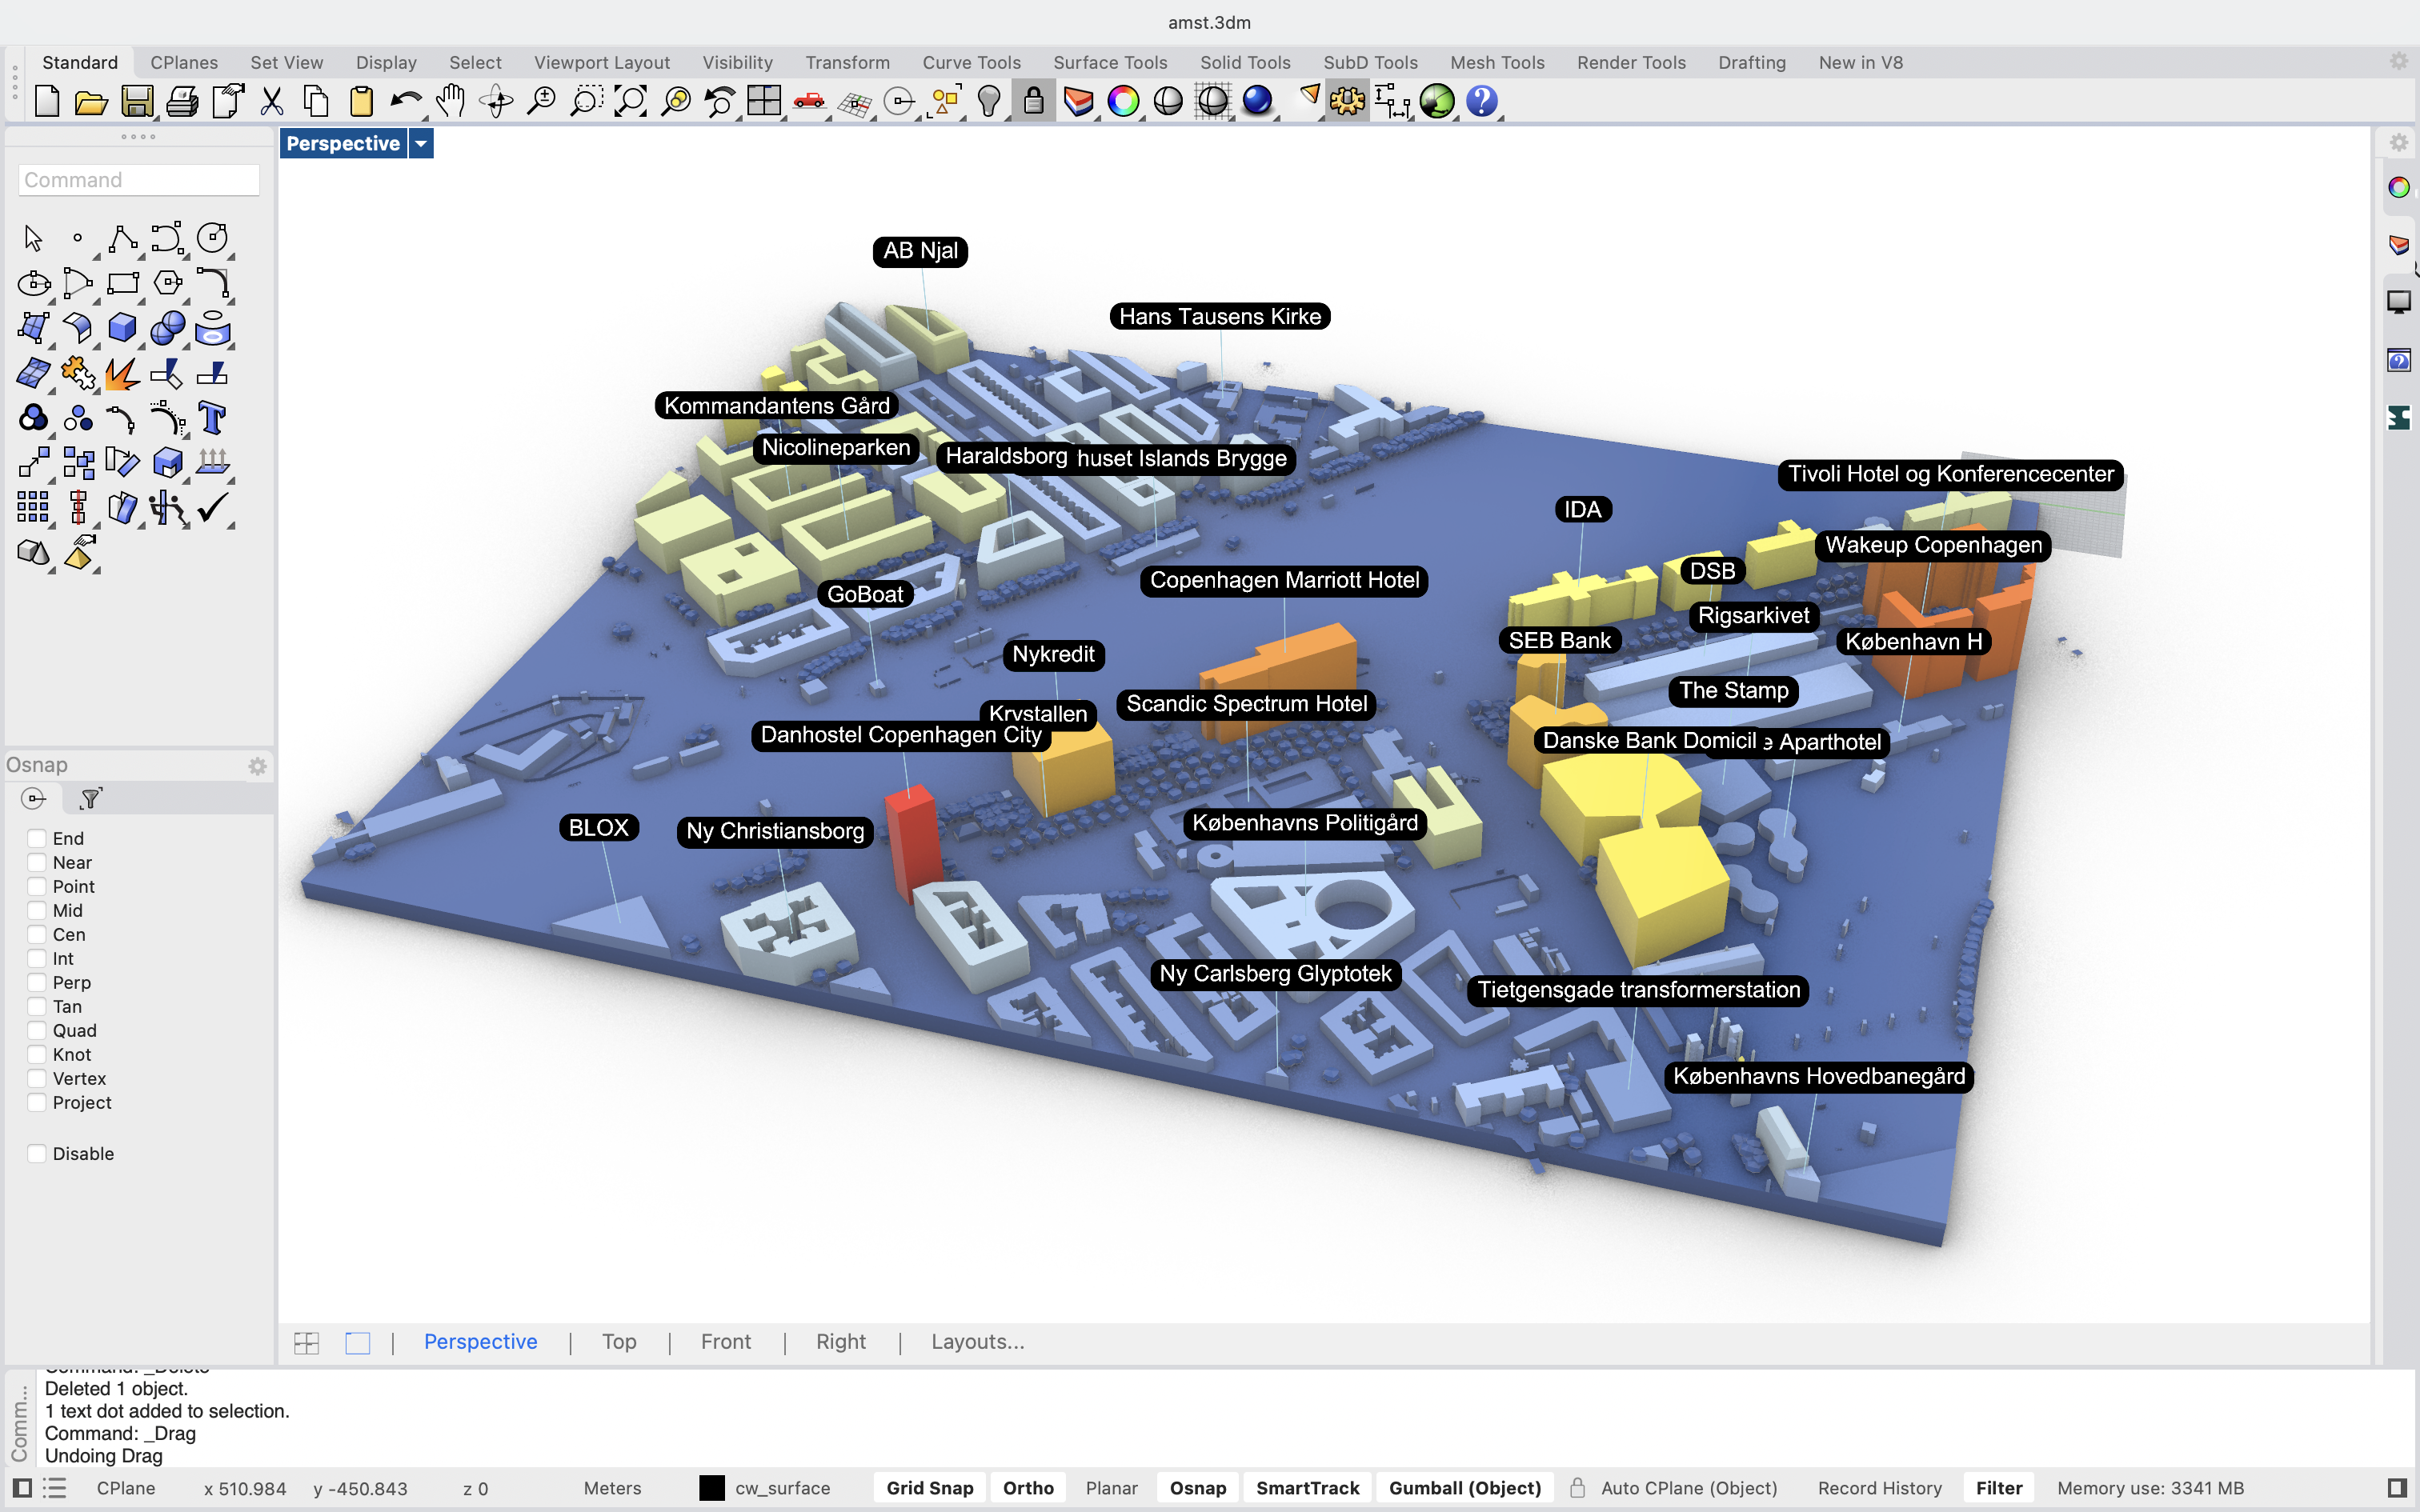
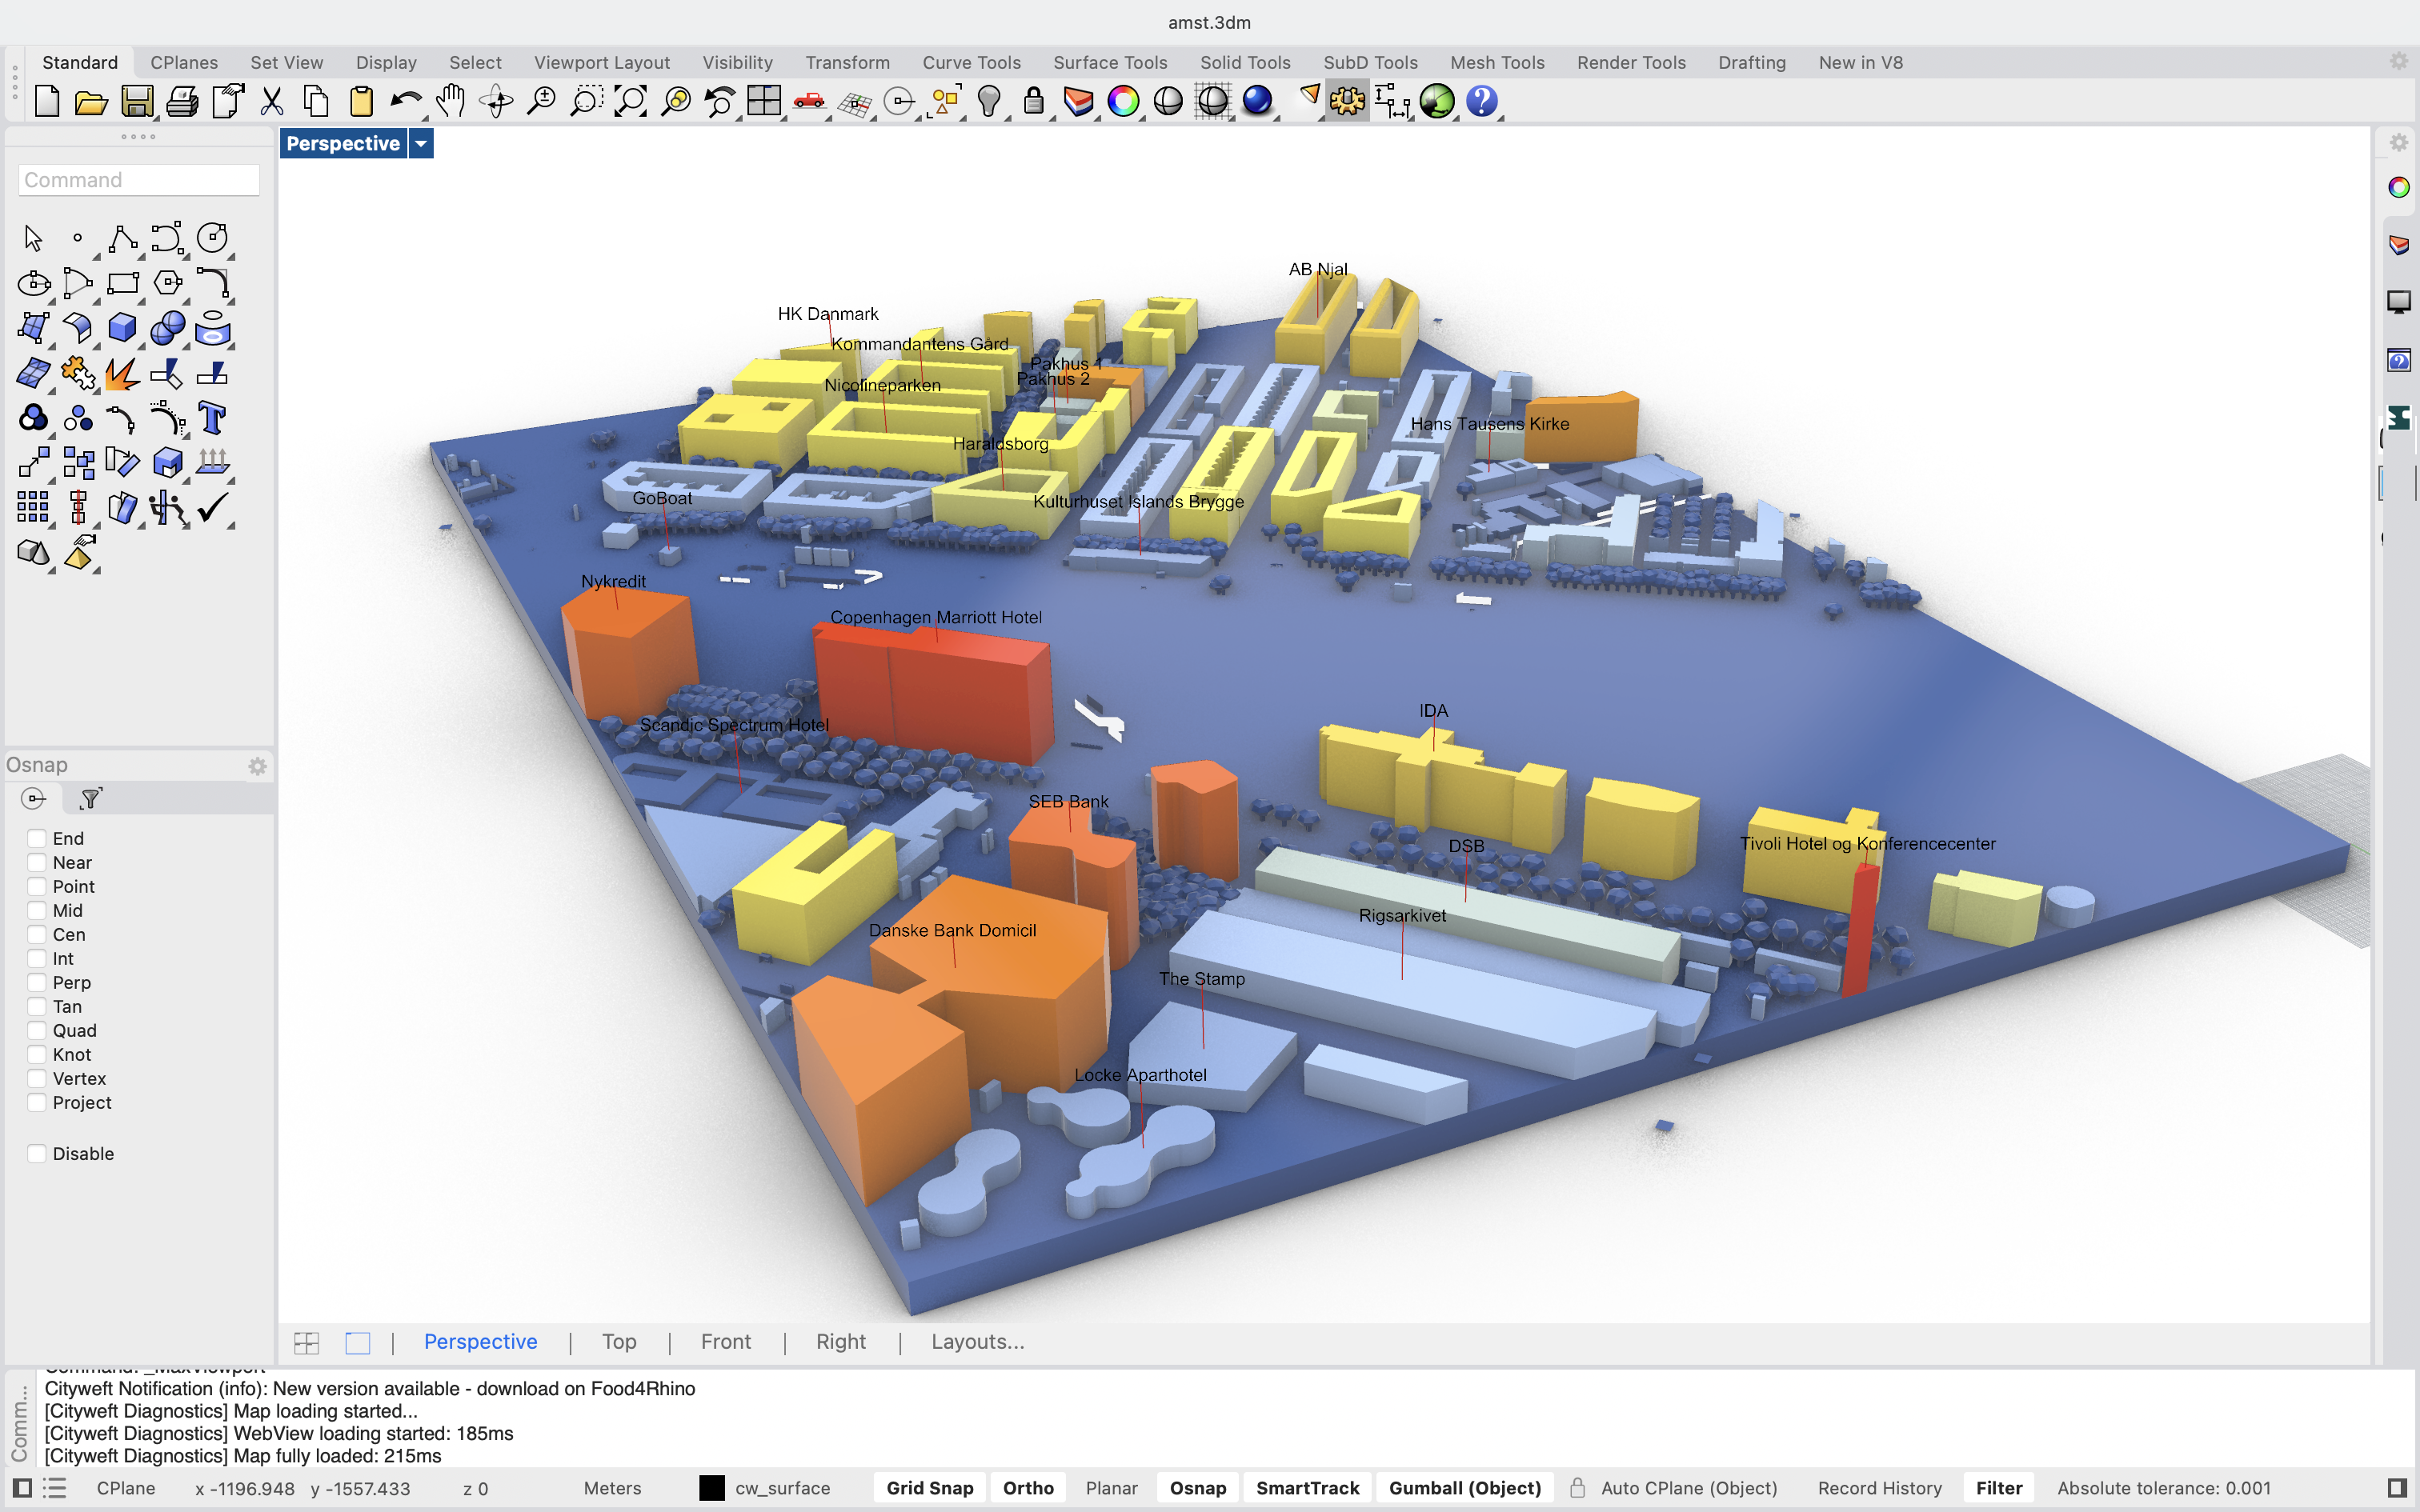
Label buildings by name
In a second example, we extract building names and:
Generate text tags
Place labels directly in the Rhino scene
This approach is ideal for:
Site analysis diagrams
Presentations
Stakeholder communication
These examples demonstrate how Cityweft acts as a foundation for custom analytical systems — rather than a closed tool.
From data to parametric workflows
The Cityweft Rhino & Grasshopper plugin is designed to support more than fast imports. It enables architects and urban designers to build repeatable, adaptable, and data-driven workflows — directly inside the tools they already use.
From controlled geometry generation to advanced metadata visualization, Cityweft helps turn city context into an active design parameter.
Want to try yourself? You can get the Rhino & Grasshopper plugins as well as a sample Grasshopper script on Food4Rhino: https://www.food4rhino.com/en/app/cityweft