From Google Maps to Usable Data: A Cityweft Walkthrough
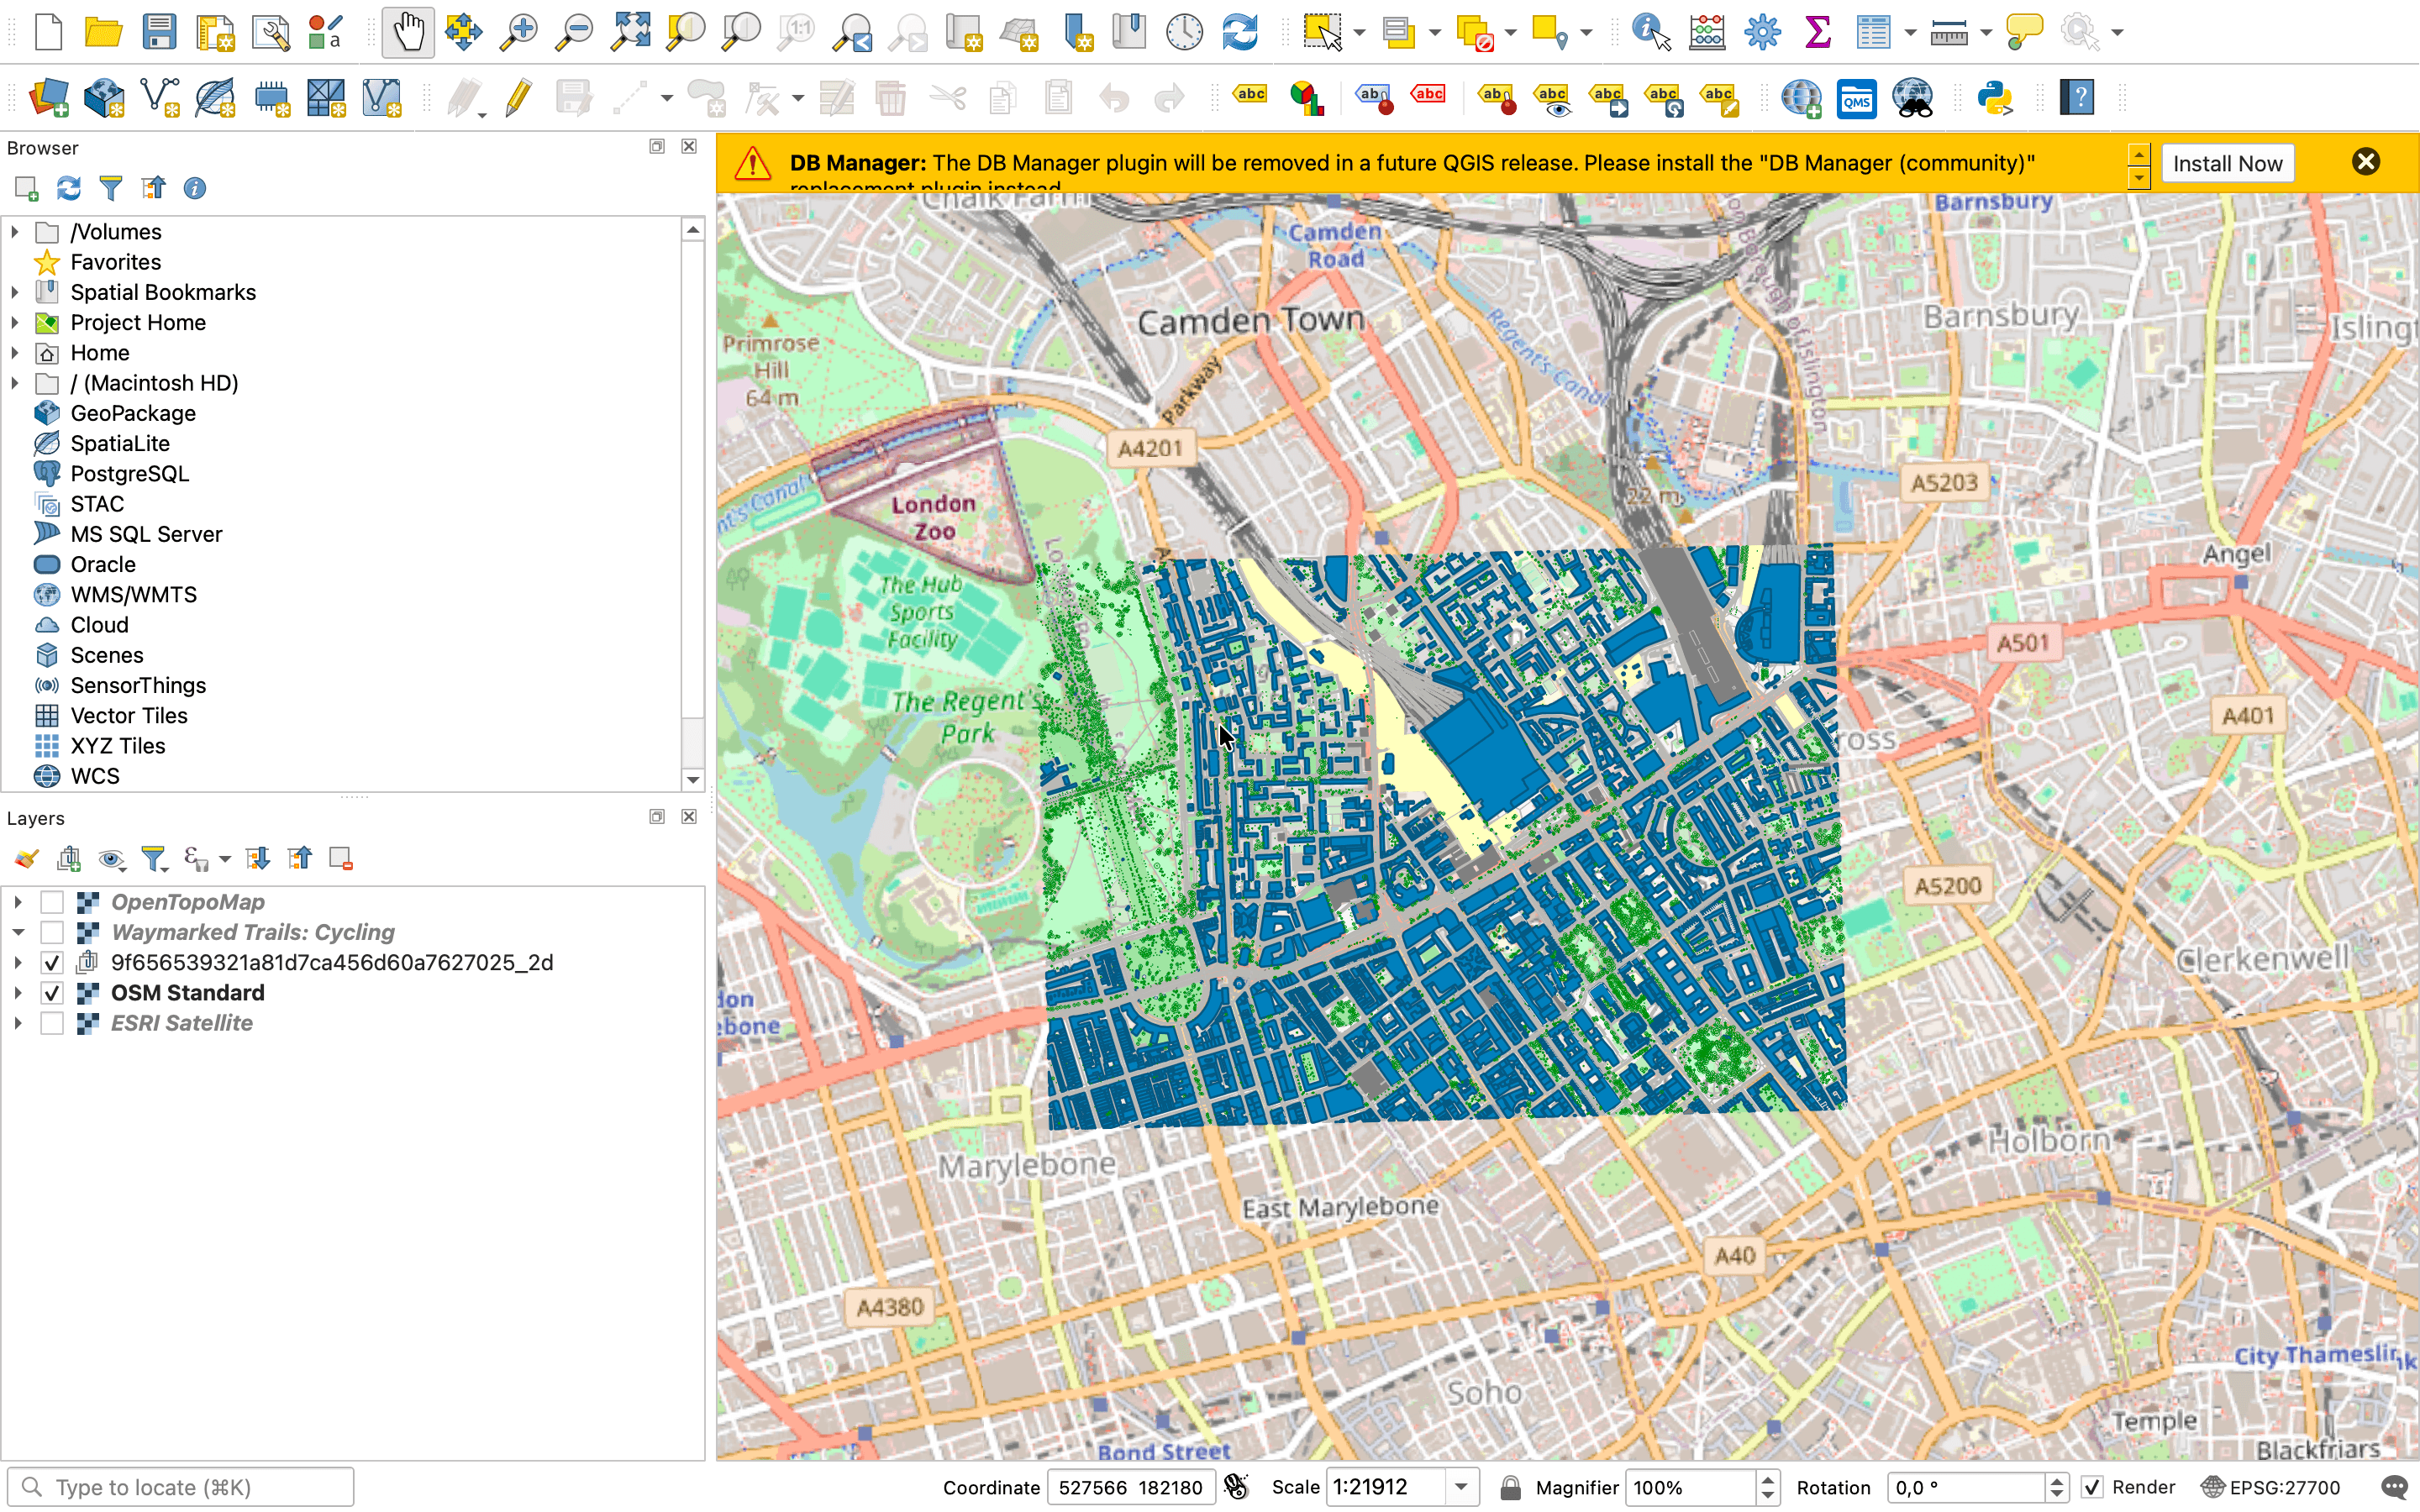
Where do you go for a first look at a site? Maybe Google Maps or Google Earth? That's usually the instinct and it was mine too when I worked in architecture and planning. The building masses are there, the facade imagery gives you a real sense of character. It's a good place to start.
But what do you do when you actually need to use that site? Massing studies, zoning checks, and infrastructure planning all needs hard data, and that’s where things get difficult. Your options tend to go one of two ways: outdated, incomplete coverage from sources like OpenStreetMap, or a manual drone scan that's accurate but expensive, and takes days to convert into something workable.
Cityweft sits between those two extremes. It's a self-serve tool: choose the data layers you want, choose the area you're interested in, and export it in a format native to the software you already use. All in only a couple of minutes.
Here's how to use it 👇
Step 1: Select an area
Everything starts with the map. Draw your area of interest, then hit preview and the model loads in just a few seconds. Previews are free, so you can see exactly what you'd be buying before you commit to anything. It’s self serve by design, so you can control what data you need and when you need to access it.
Step 2: Choose your data layers
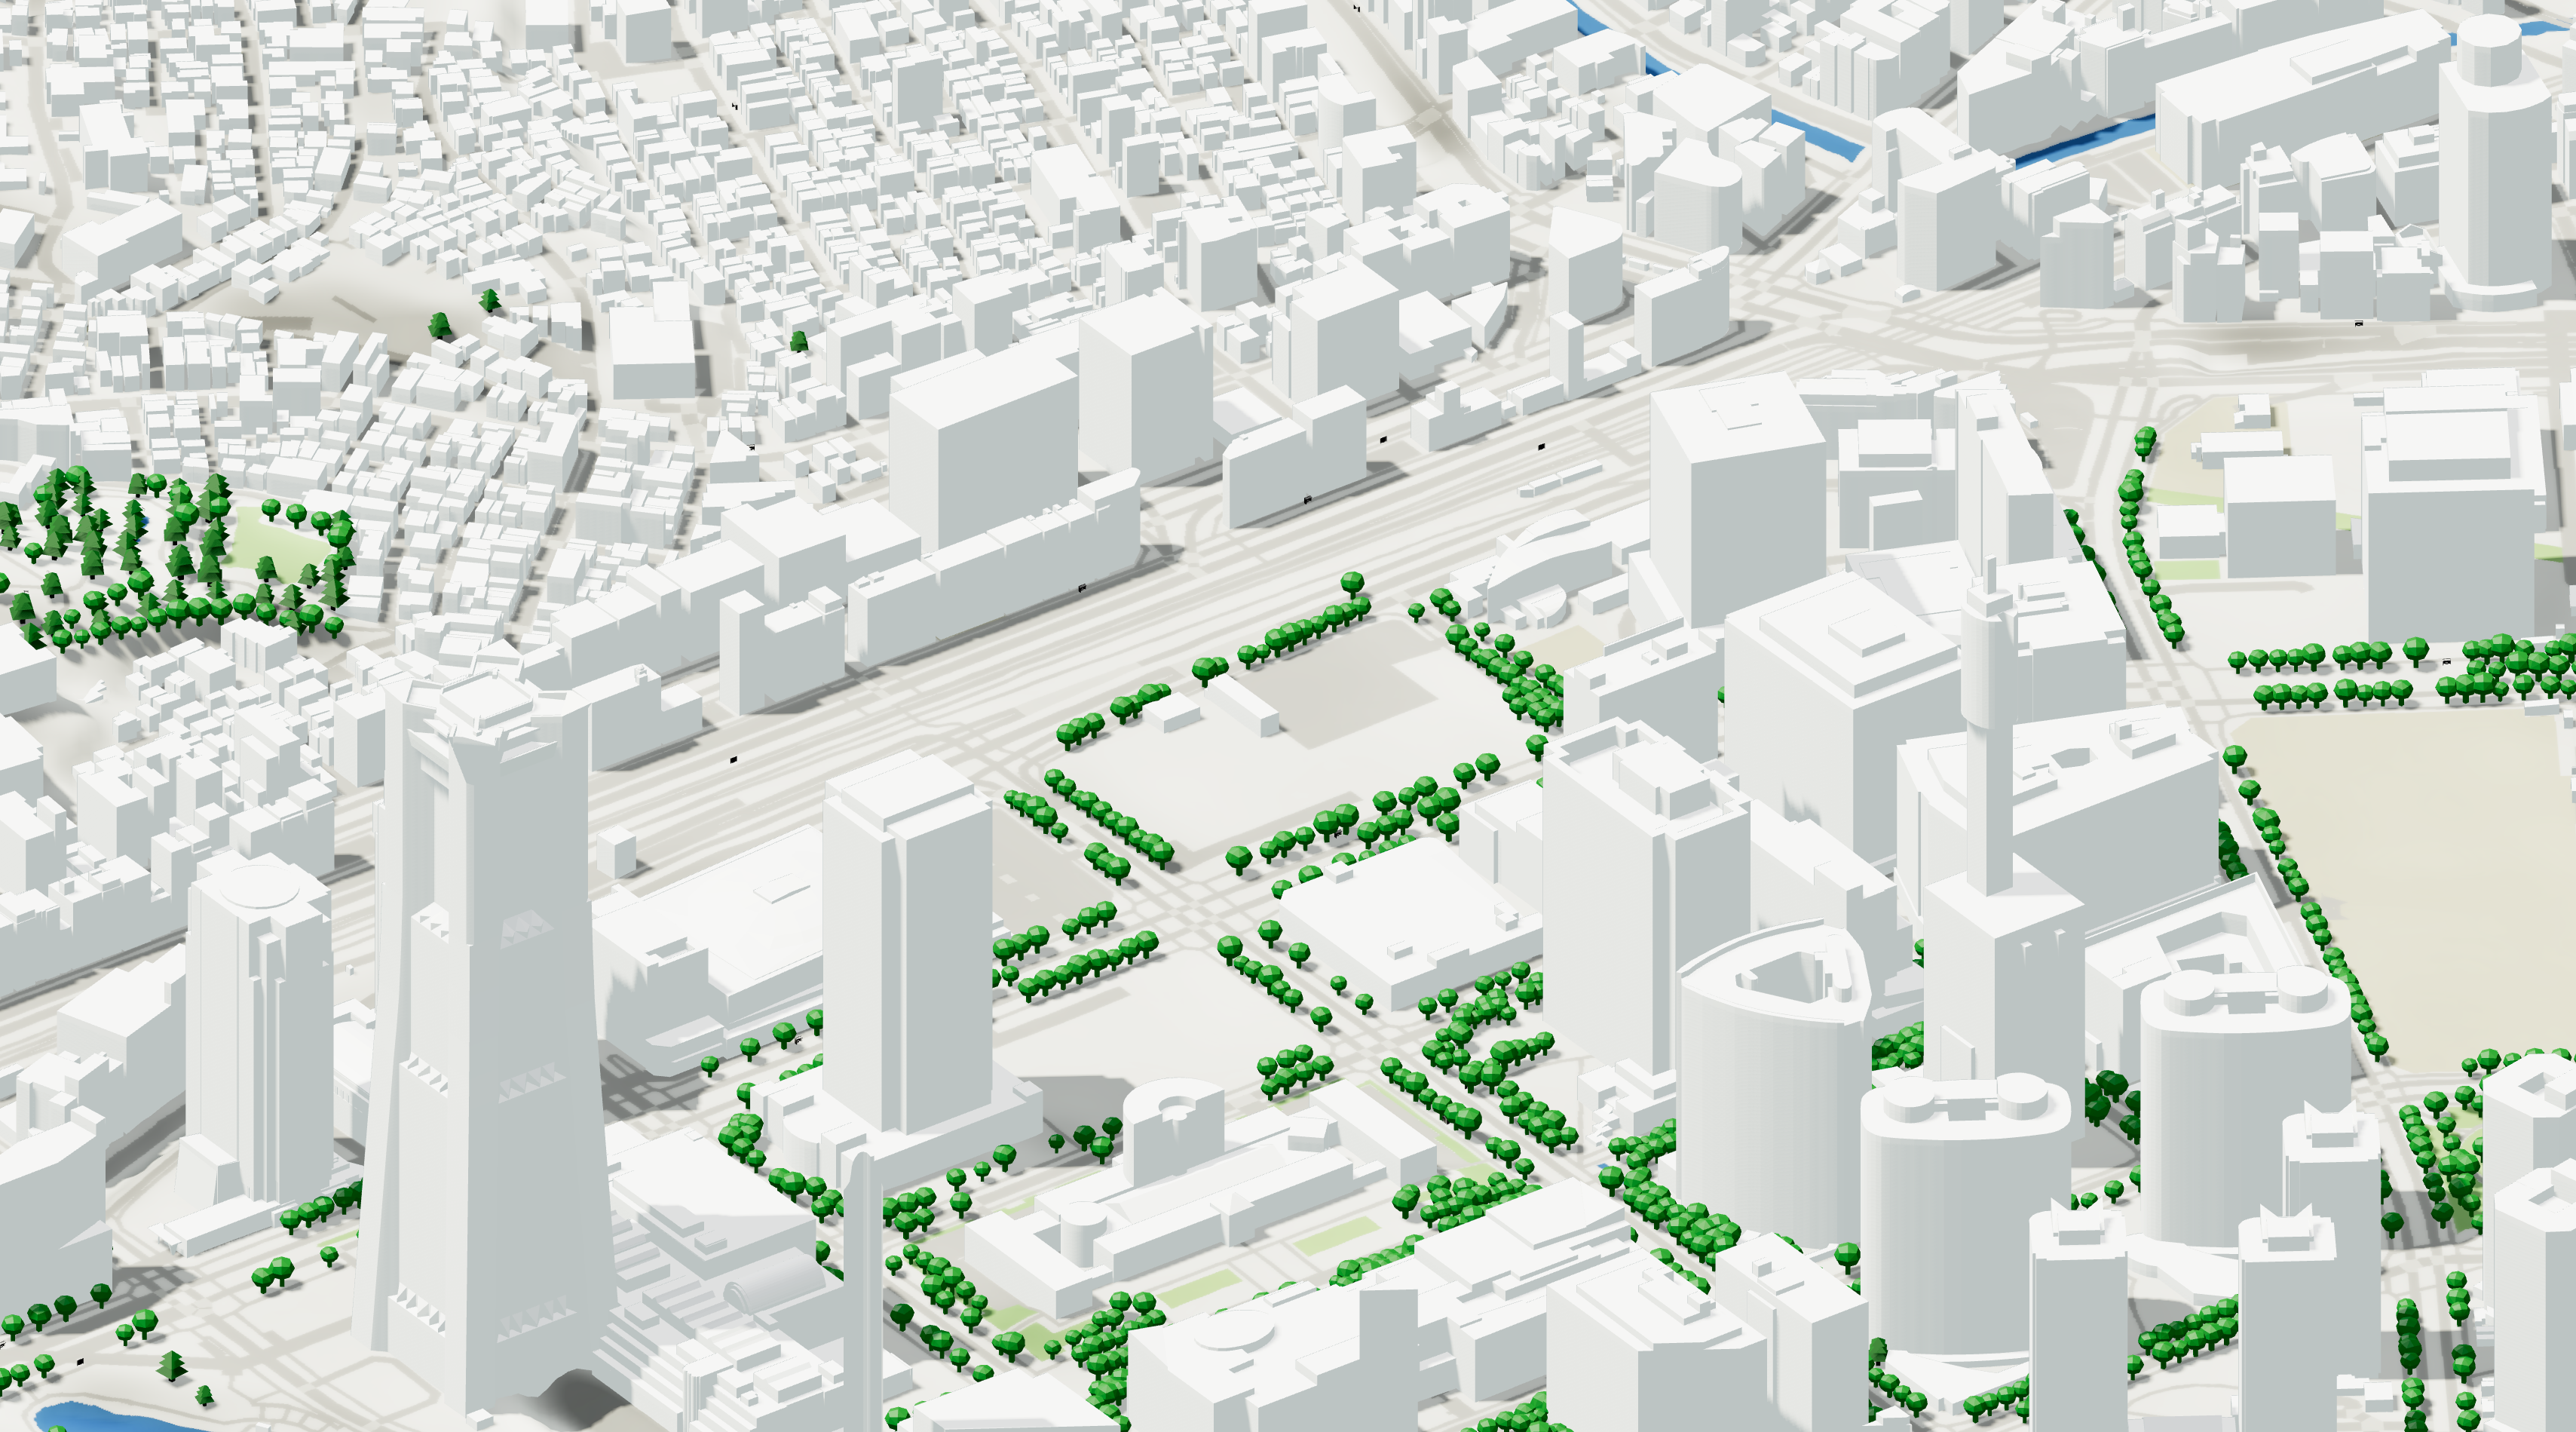
Once the preview has loaded, you decide what goes into the model, building datasets, tree detail, bus stops, and more. An early feasibility study might only need massing, so you have the option to keep it light. An infrastructure project might need bus stops, benches, and accurate tree placement, so you can turn those on.
Not every project needs every layer. The point of Cityweft is that you only take what the project actually needs, at whatever stage you're at.
Step 3: Export
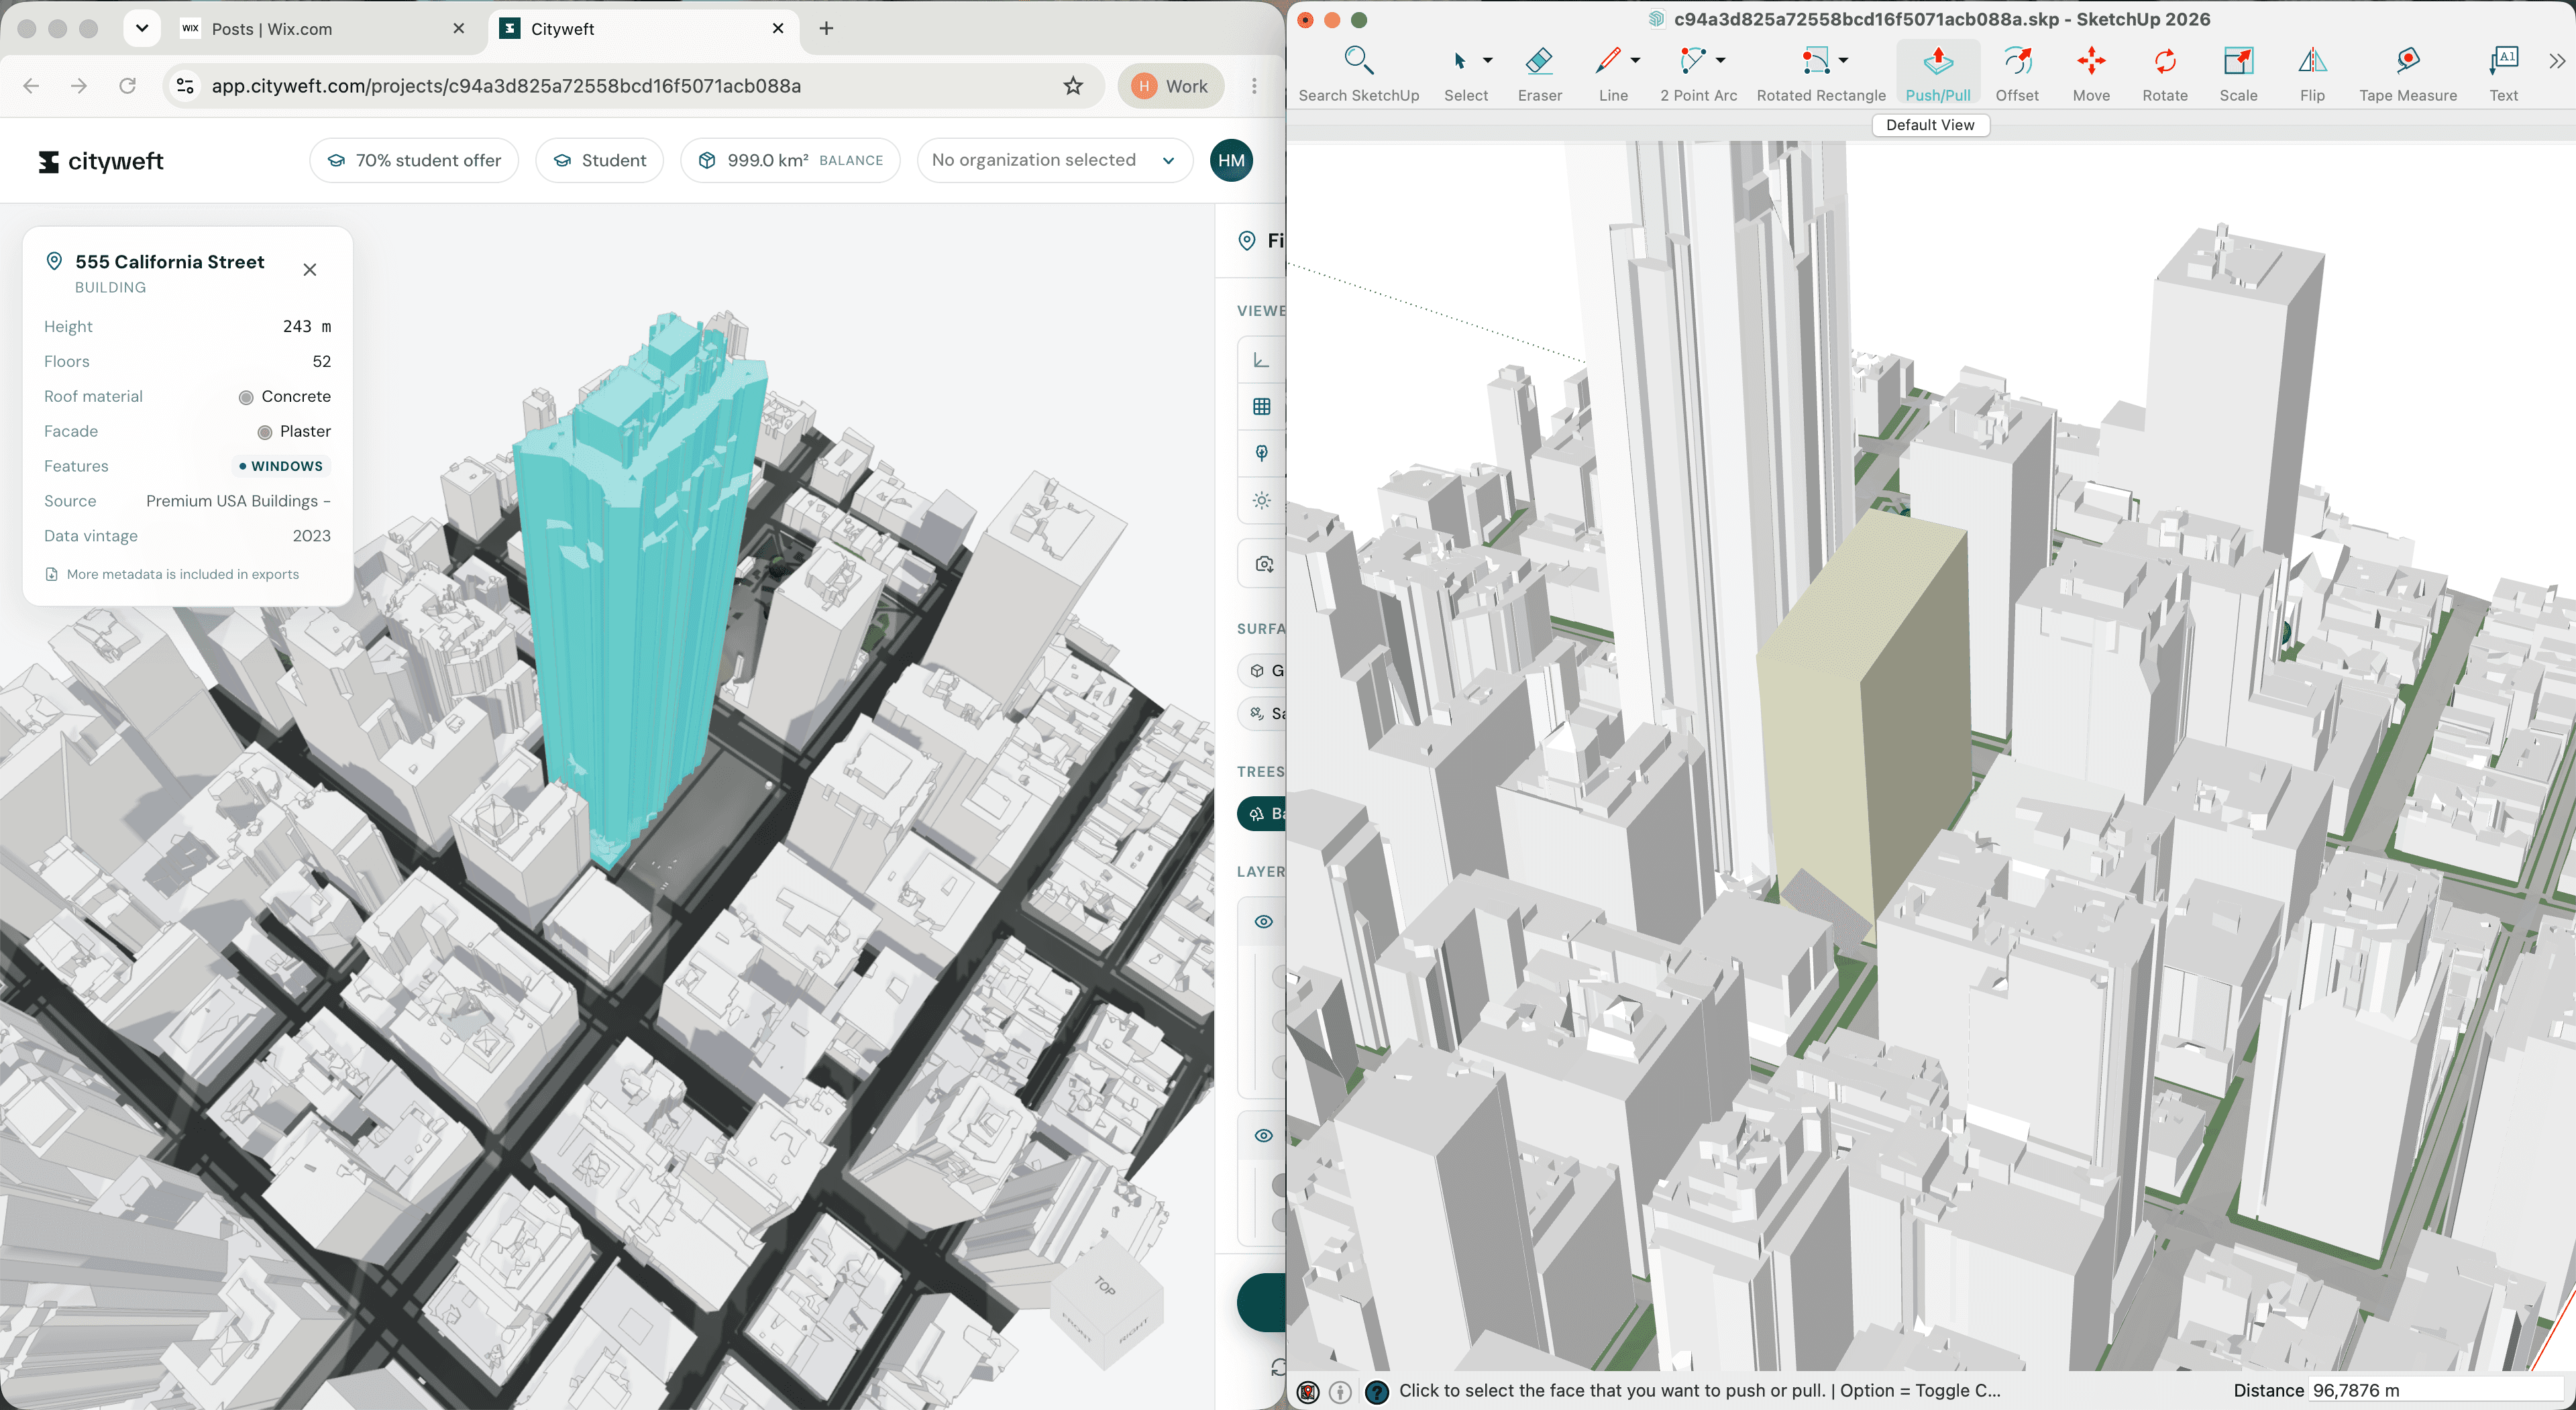
Pick your format (from .skp, .rvt, .3dm and much more) and hit export. The model generates in less time than it takes to make a coffee. Comparing that to the days a manual scan-to-model process can take, it's pretty unbeatable.
Step 4: Drag it straight into your software
Since the export is native to the tools you already use (Rhino, Revit, Sketchup, Autocad and beyond) there's no cleanup step. Open it in your tool and it's ready to work with immediately.
When you open the file you'll find it organised the way you'd organise it yourself: editable components, sensible layers, nothing to reorganise before you can start designing.
Bonus Step: Google Maps Comparison
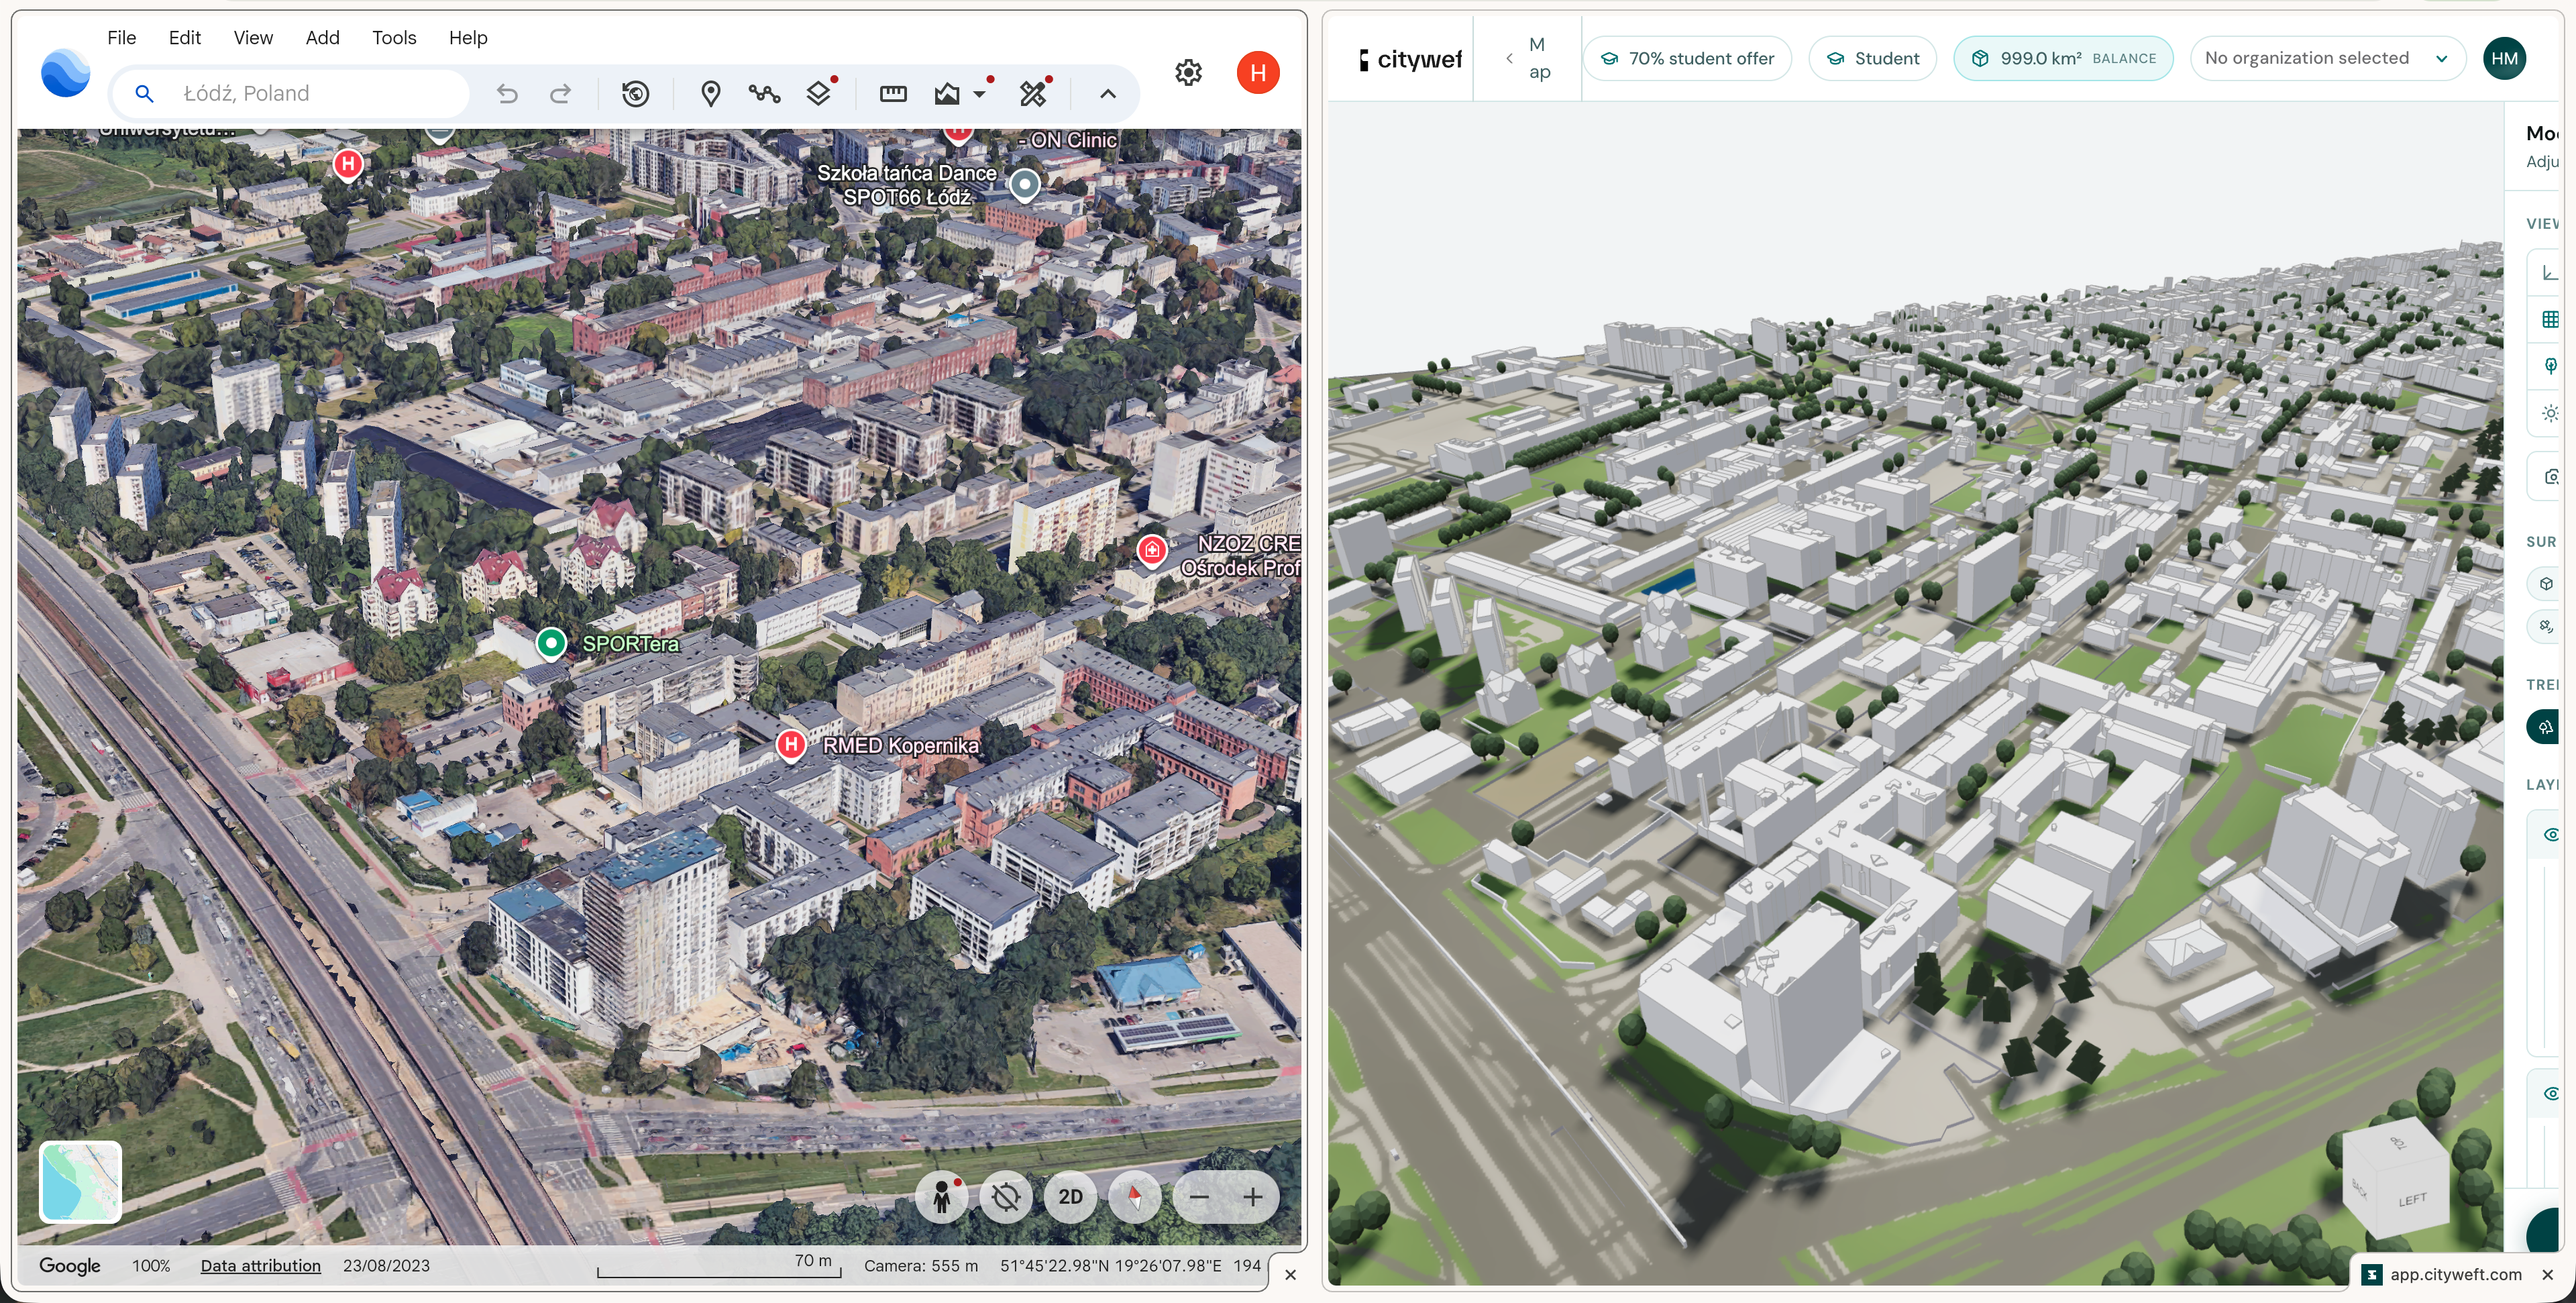
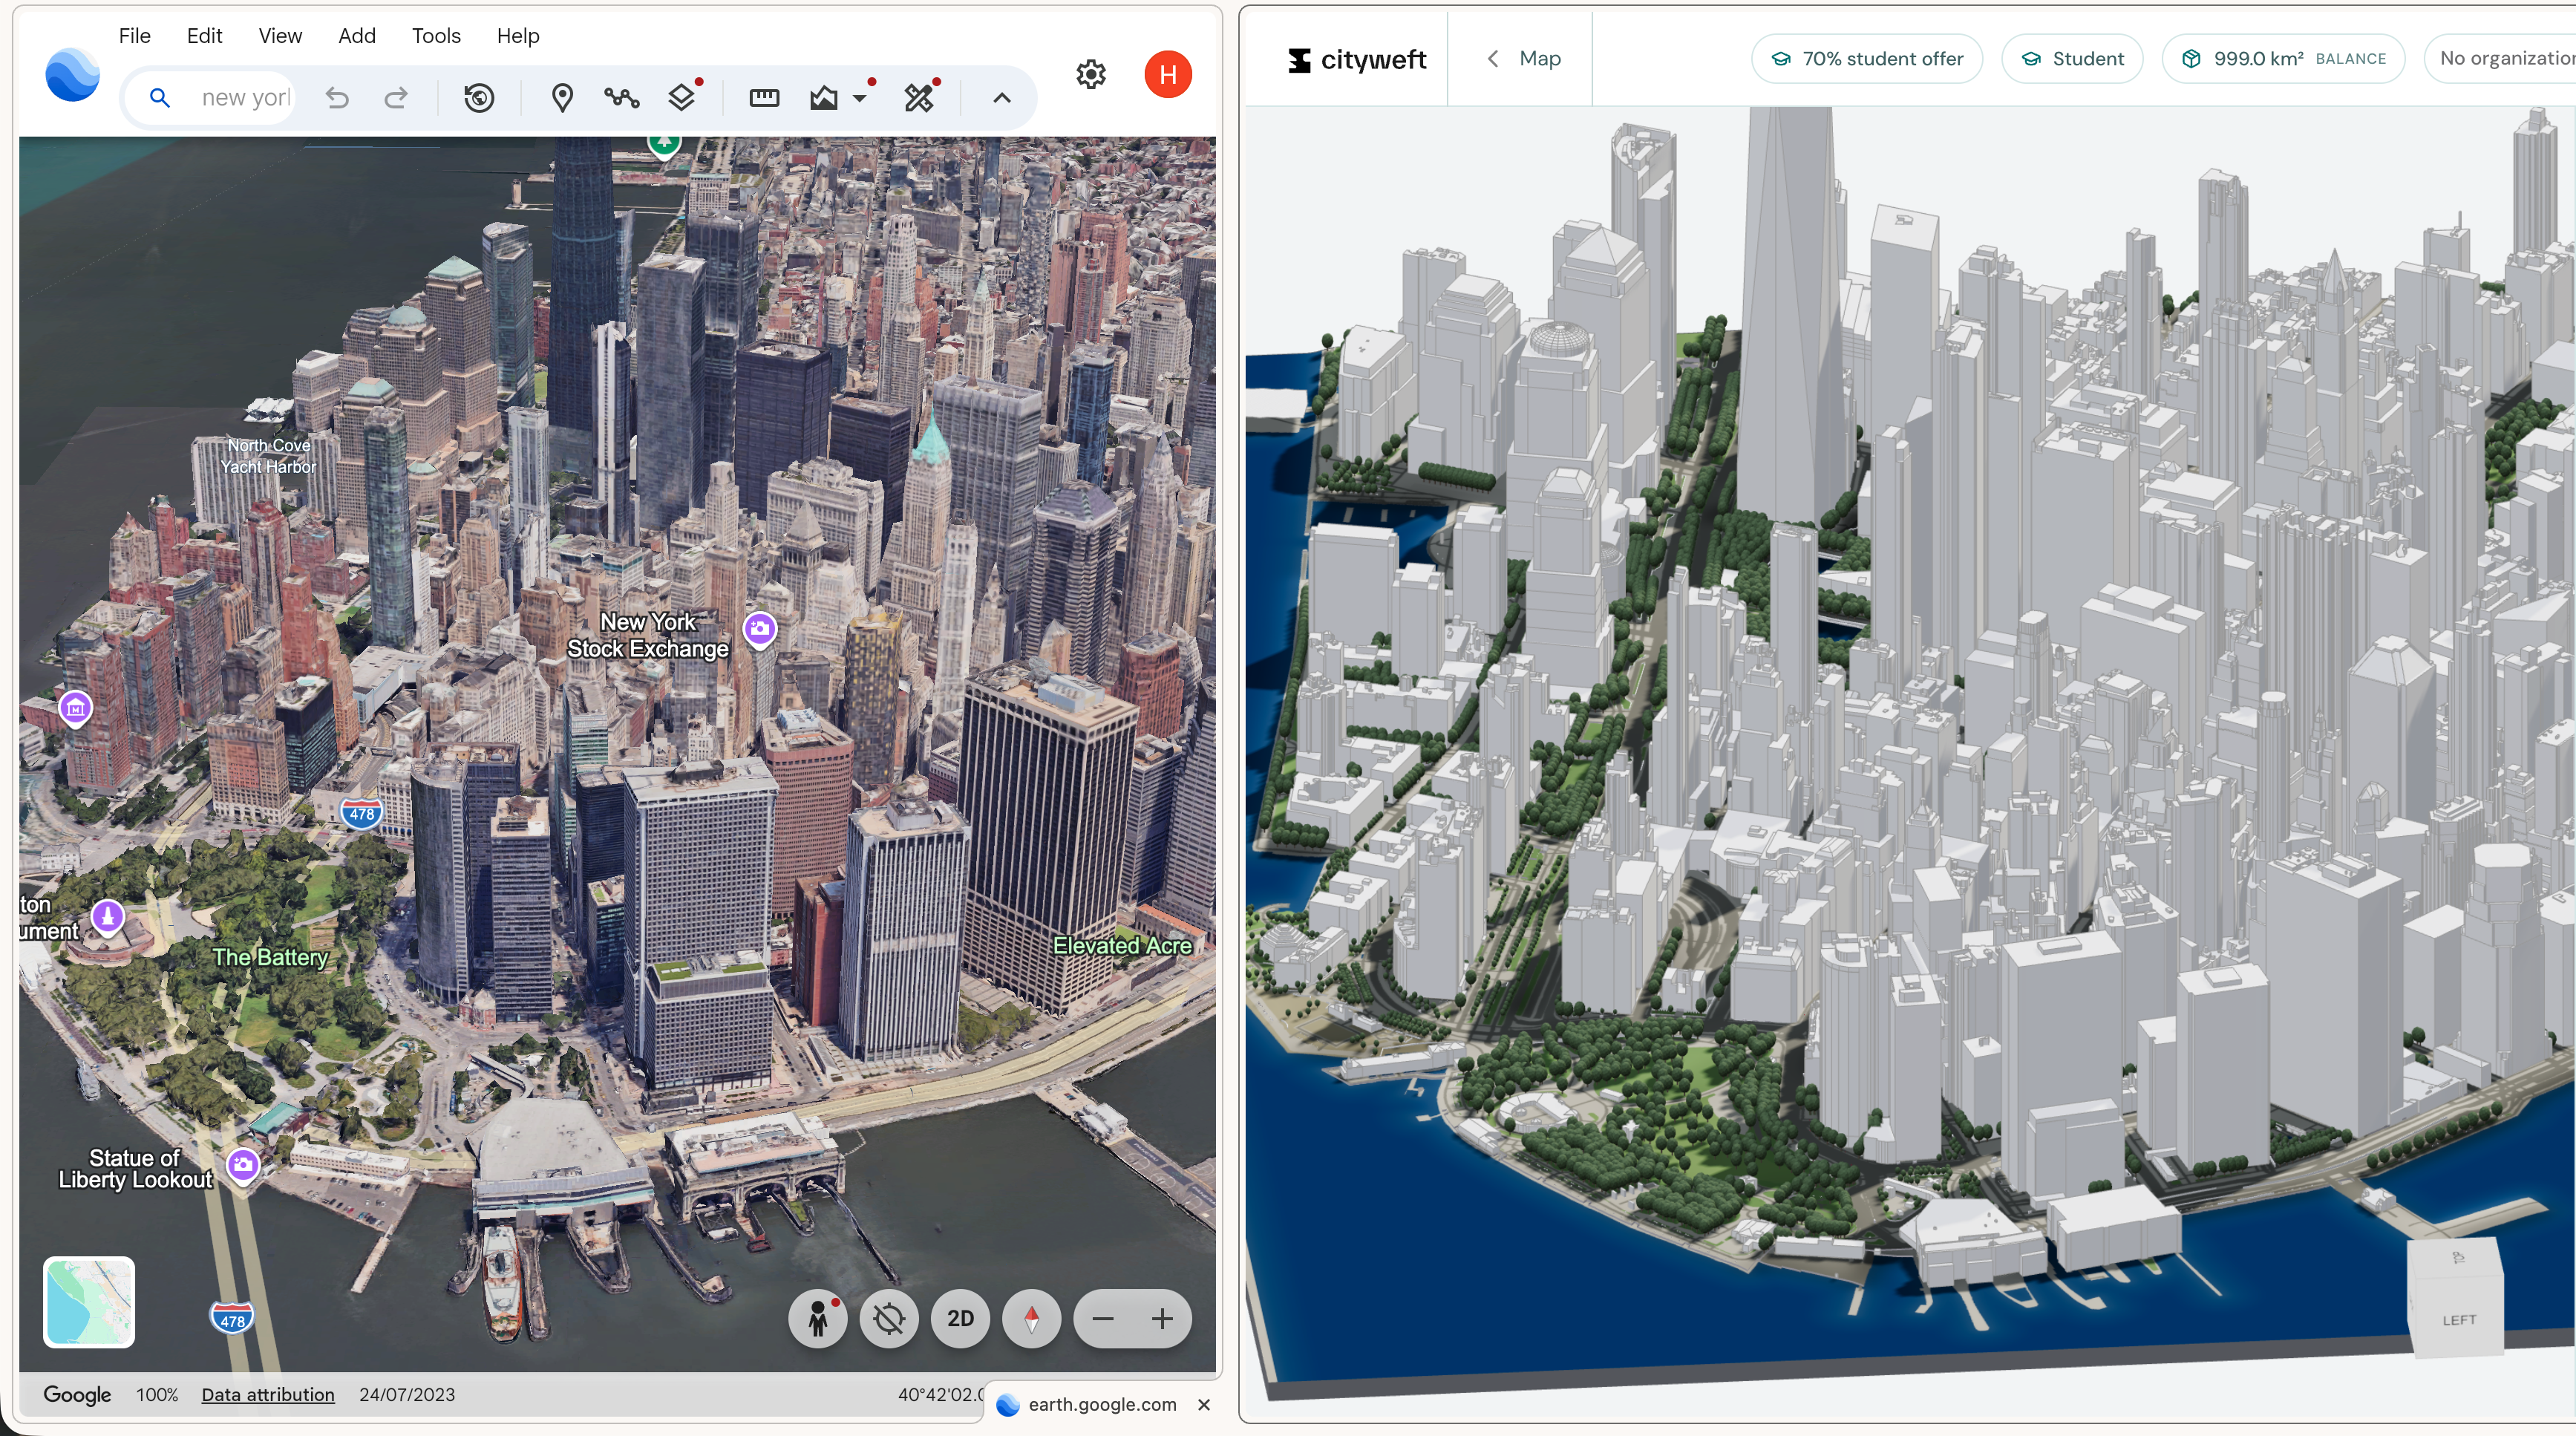
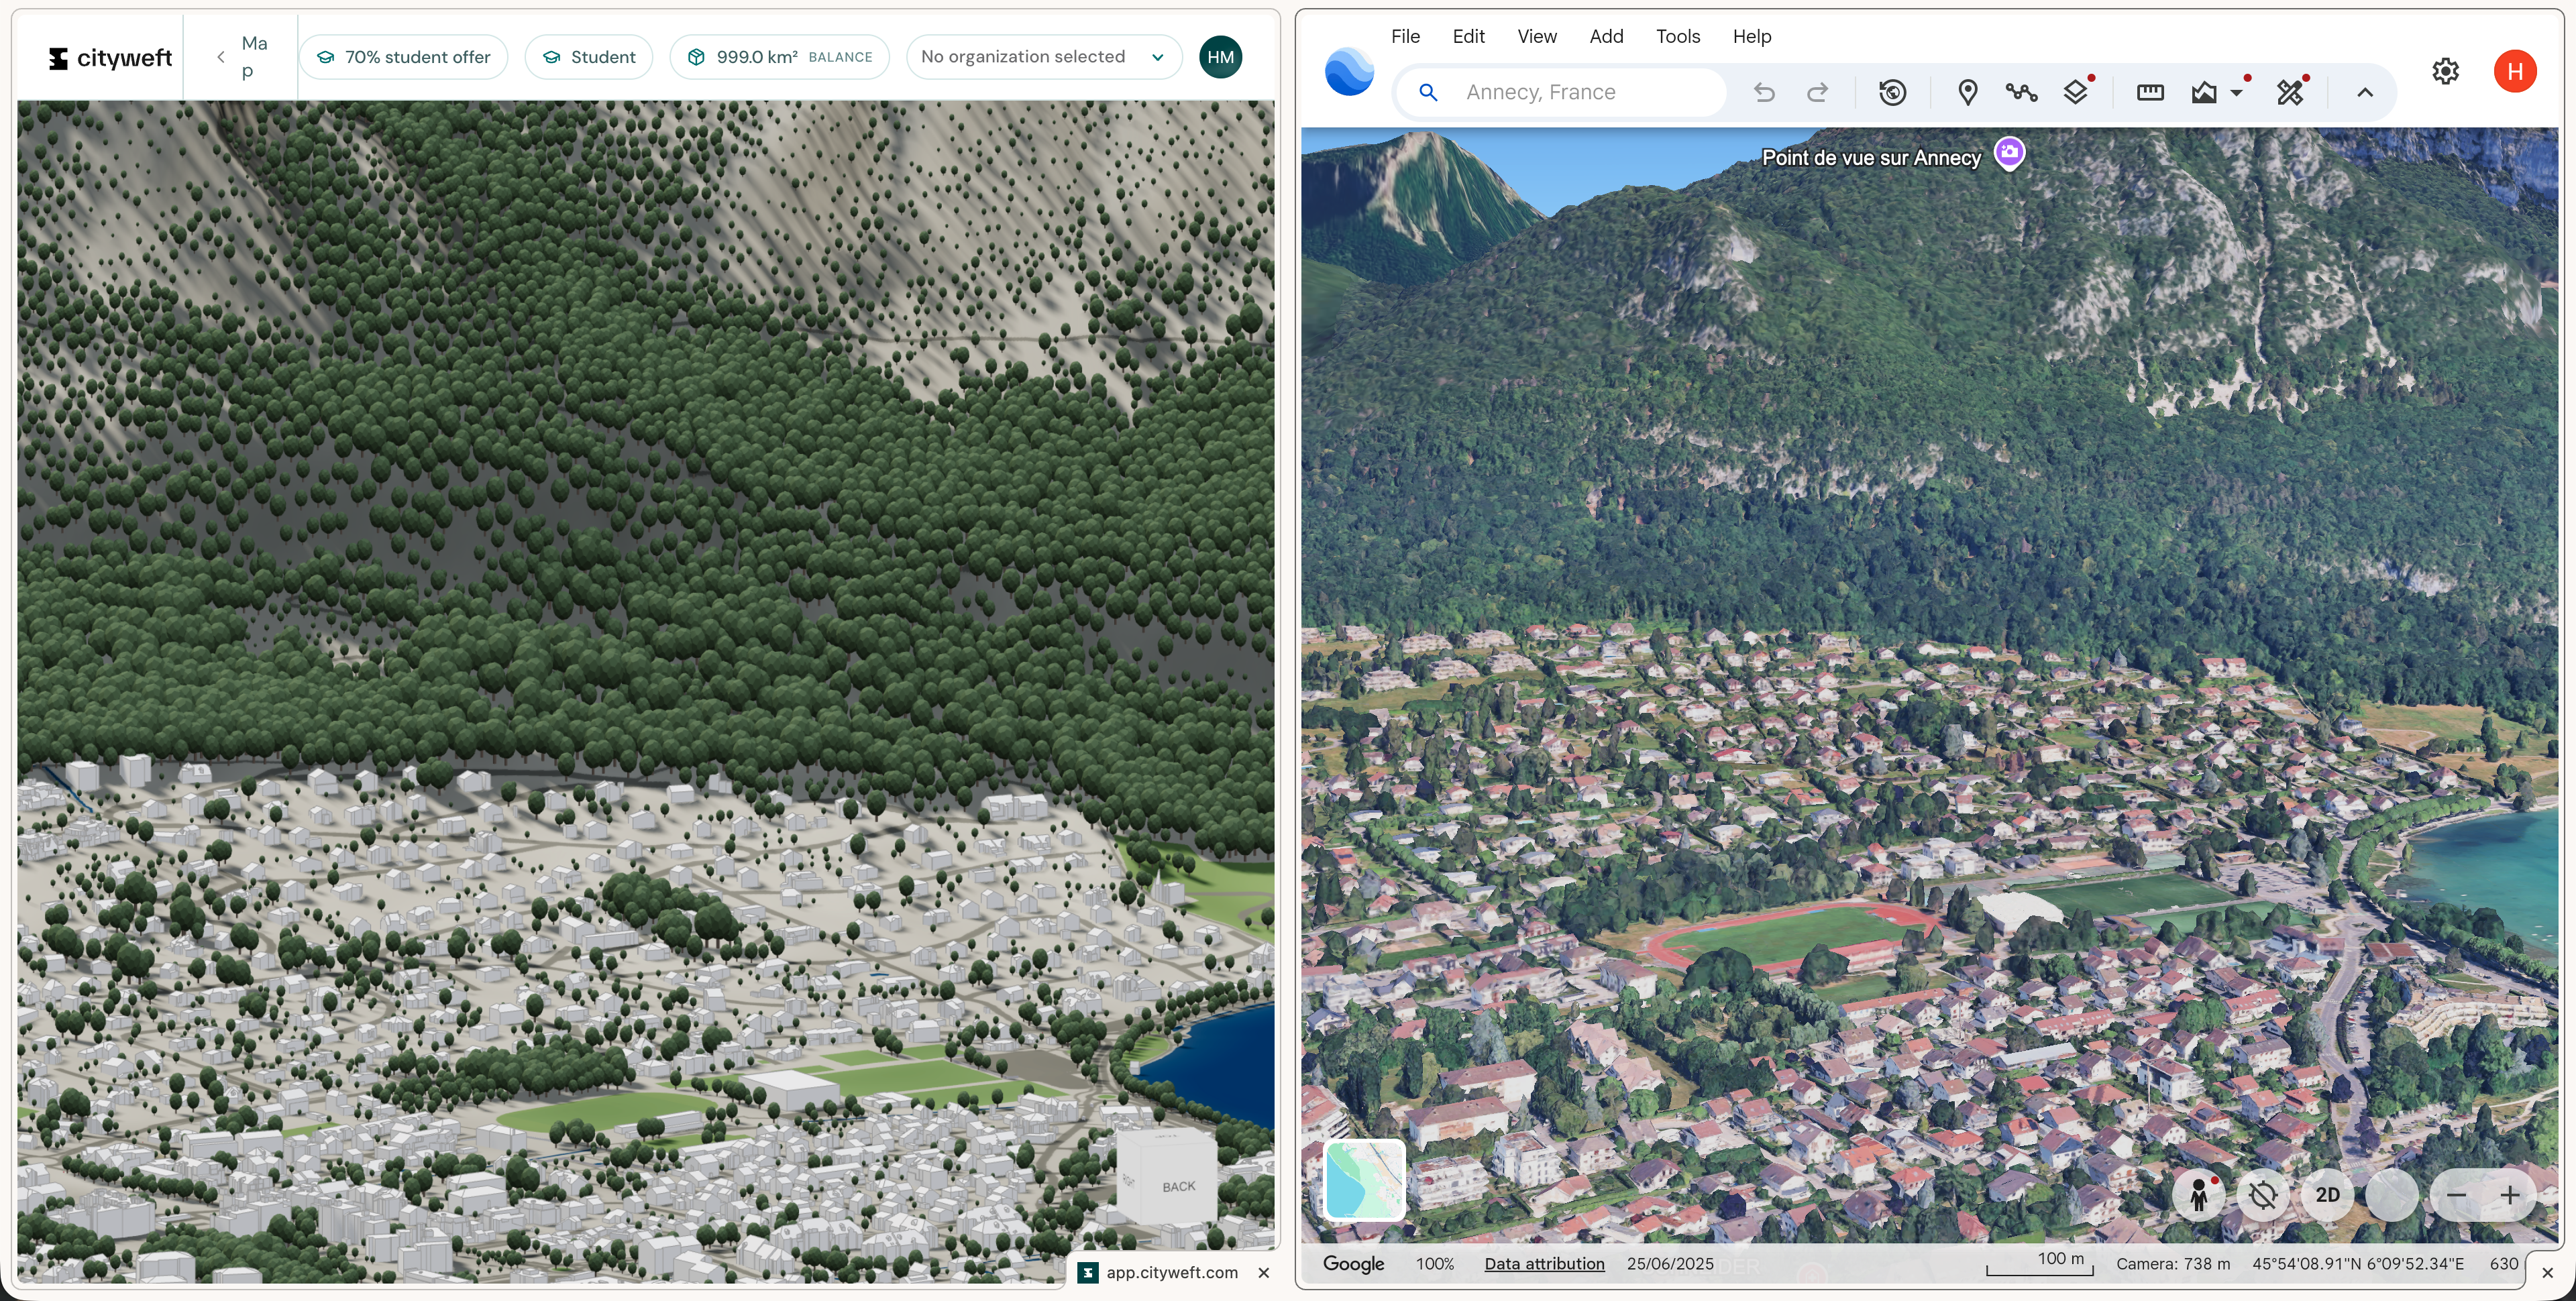
You might additionally want to compare your Cityweft model to what you see in Google Maps. Below are a few comparisons we've done, so you can see that the data exported from Cityweft is generally conistent with, if not better than, Google Maps.
Try it yourself
Cityweft is the fastest way to get accurate site data, in the format you already work in. Previewing a site is free, so the easiest way to see the speed for yourself is to try it on your next project.